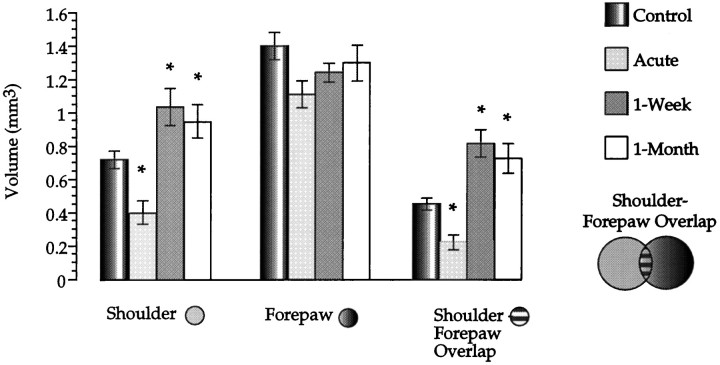
Fig. 2.
Volume of three thalamic sensory maps at different times after nucleus gracilis lesions. A different group of animals was used for each time point. The recording sites included in the calculation of each sensory map are depicted. Asterisksindicate significant differences between a given treatment group compared with controls. Columns indicate mean; error bars indicate ±SE.

