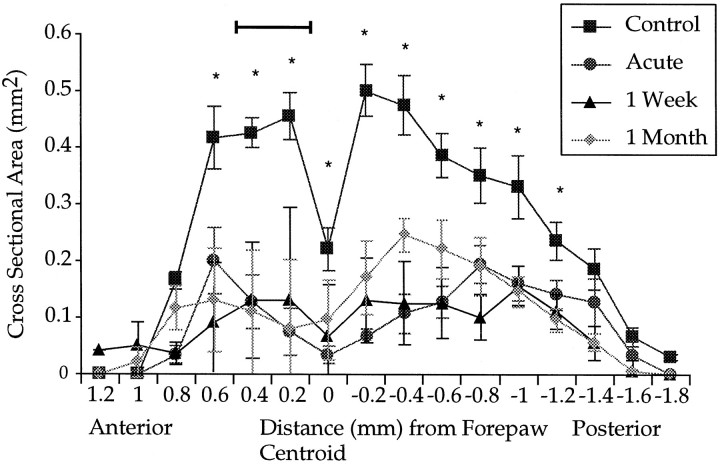
Fig. 5.
Plot of residual hindlimb input as a function of the anteroposterior axis. Abscissa coordinates are the same as those in Figure 3B. The area of hindlimb input corresponding to the focal zone relative to the forepaw centroid is indicated by the bar. Asterisks indicate significant differences between all treatment groups compared with control values. Error bars indicate ±SE.

