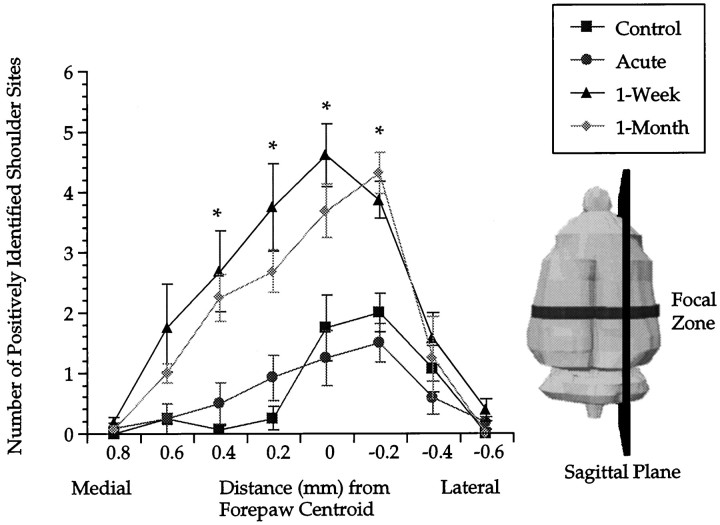
Fig. 7.
Cross-sectional area profile of shoulder representation. The focal zone is represented as a dark band in the coronal plane, which was cut sagittally with reference to the intact rat brain. Asterisks indicate significant differences between control versus 1 week and 1 month groups after lesion. As far as 0.6 mm medial to the forepaw centroid, 1 month postlesion was significantly elevated compared with control. Error bars indicate ±SE.

