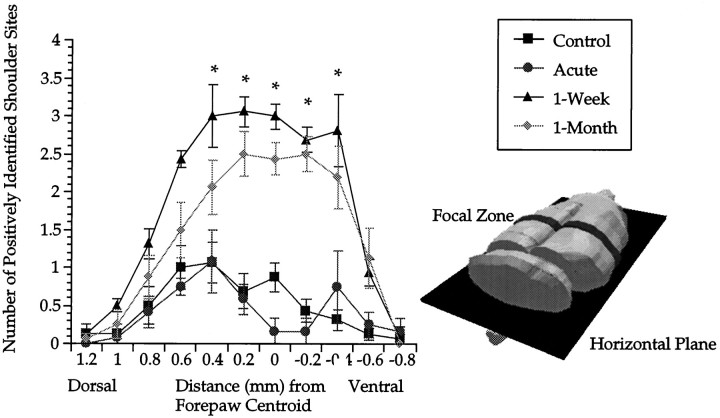
Fig. 8.
Profile of shoulder sensory representation, revealed by cross-sectional slices in the horizontal plane. The focal zone is indicated as a dark coronal band, sectioned with reference to the intact rat brain. Asterisks indicate significant differences for both 1 week and 1 month postlesion groups versus control. Error bars indicate ±SE.

