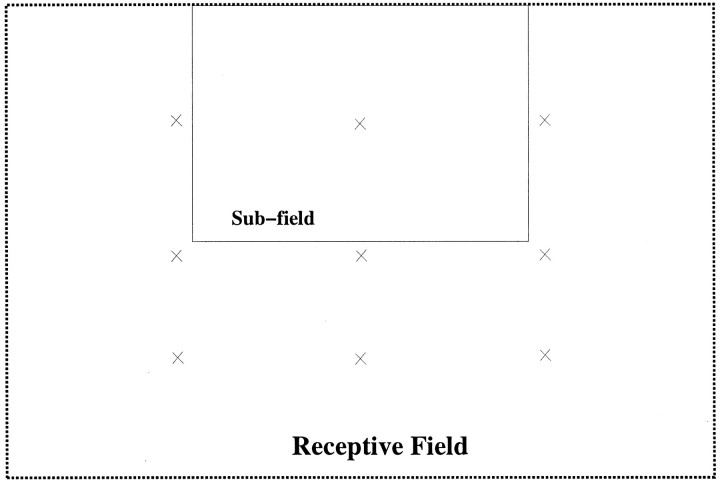
Fig. 10.
Subfield test for response selectivity. Flow-field stimuli such as those shown in Figure 7 were shrunken and placed in nine different positions within the receptive field of each unit. Each X marks a center of one of the nine stimuli, and the size of the subfield occupied by the shrunken stimulus is indicated by the rectangle within the receptive field.

