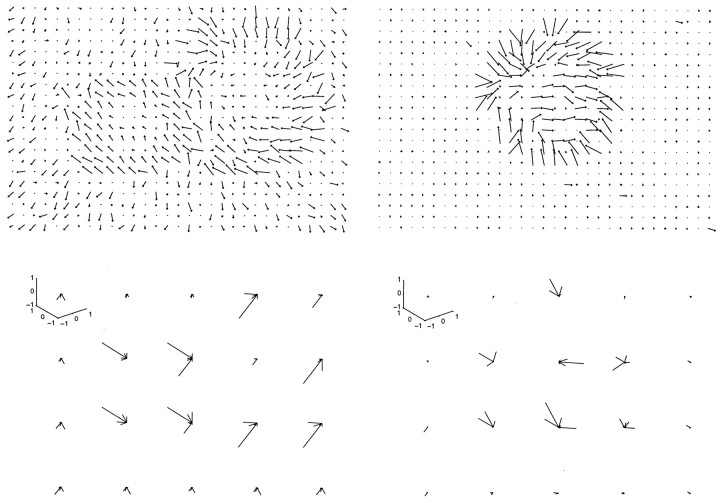
Fig. 14.
The output of the velocity module on the two test movies from Figure 4 is shown below the respective flow field. Each velocity unit is plotted within its local pool as a vector pointing in its preferred 3-D direction, with a magnitude proportional to its activity. A histogramming technique was used to extract local velocity from this coarse-coded representation. These two examples demonstrate that several pools may represent the same underlying velocity and that a single pool can represent two velocities when the relevant region in the flow field contains a motion border.

