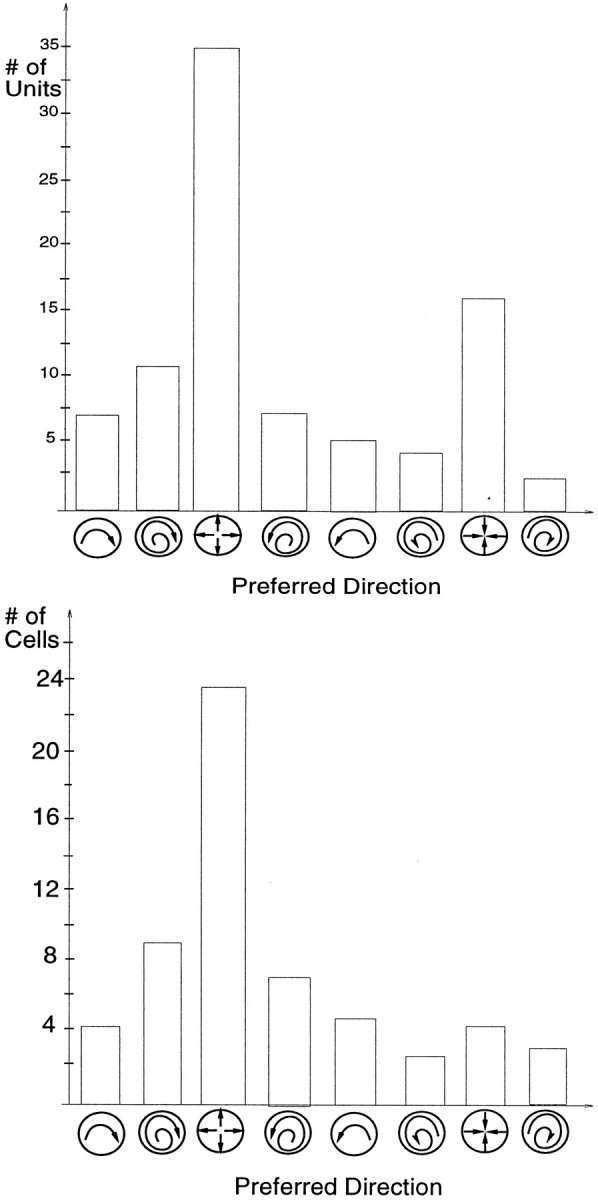
Fig. 9.

Preferred directions for the spiral selective units in the model, and for the selective cells in the Graziano et al. (1994) study. The height of each bar in a histogram represents the number of units or cells having a preferred direction within 45° of a particular motion type. Top, Of the 142 selective model units, 87 preferred a direction in the spiral space.Bottom, The direction of preferred responses for the 57 cells with smooth tuning curves and good Gaussian fits in the Graziano et al. (1994) study.
