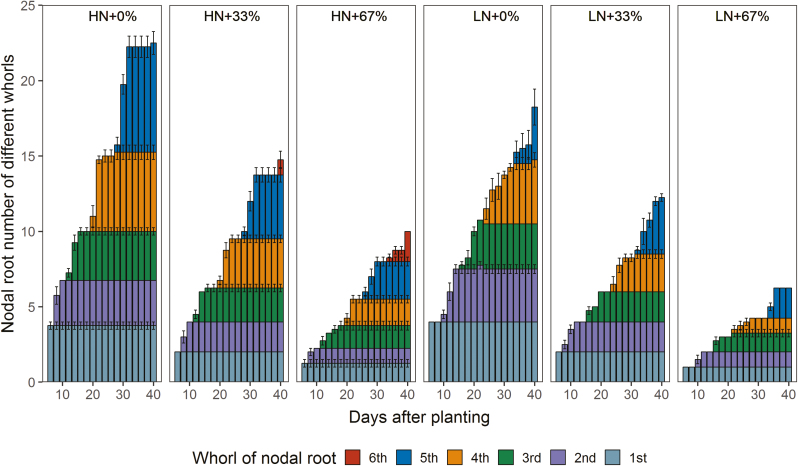
Fig. 4.
NRN of different whorls with time in the greenhouse mesocosms. Each column with the same color represents the mean of n=4 for each treatment. Error bars represent SEs. HN+0%, 0% NRE under high N; HN+33%, 33% NRE under high N; HN+67%, 67% NRE under high N; LN+0%, 0% NRE under low N; LN+33%, 33% NRE under low N; LN+67%, 67% NRE under low N.

