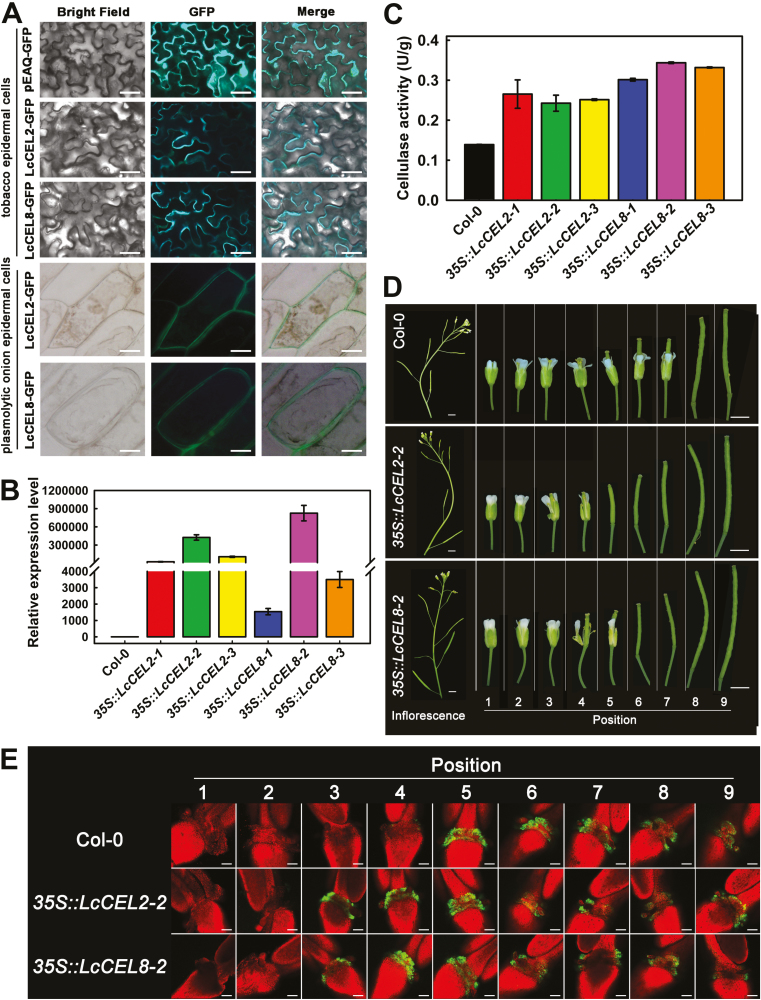
Fig. 4.
Functional analysis of litchi LcCEL2 and LcCEL8. (A) Subcellular localization of LcCEL2-GFP and LcCEL8-GFP fusion proteins in tobacco leaves and plasmolytic onion epidermal cells. (B) Expression of LcCEL2 and LcCEL8 in leaves of different transgenic Arabidopsis plants. The 35S::LcCEL2-1, 35S::LcCEL2-2, and 35S::LcCEL2-3 lines ectopically expressed LcCEL2 under the control of the CaMV 35S promoter in wild-type plants (Col-0). The 35S::LcCEL8-1, 35S::LcCEL8-2, and 35S::LcCEL8-3 lines ectopically expressed LcCEL8 under the control of the CaMV 35S promoter in Col-0. AtUBQ was used as an internal control for qRT-PCR analysis. The y-axis represents the fold-change in the expression levels relative to Col-0. Data are means (±SE) from three replicates. (C) Cellulase activity in leaves of different transgenic Arabidopsis plants. Data are means (±SE) from three replicates. (D) Phenotypes of floral organ abscission in transgenic Arabidopsis lines. Position numbers were counted from the first flower with visible white petals at the top of the inflorescence. (E) BCECF fluorescence micrographs of floral organ abscission zones in transgenic Arabidopsis lines. The images represent BCECF fluorescence merged with chlorophyll autofluorescence. An increase in pH is indicated by green fluorescence; chlorophyll autofluorescence is in red. Representative images are shown from 3–4 replicates in total. Scale bars are 25 μm (A), 3 mm (D), and 100 μm (E).

