Fig. 6.
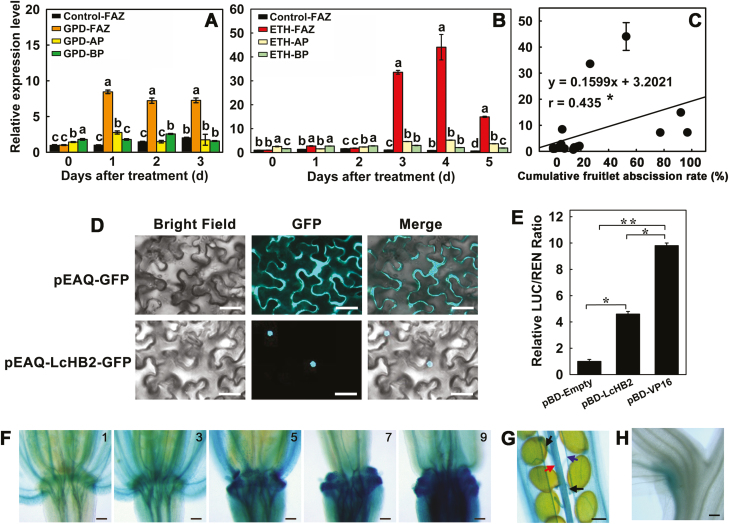
Expression patterns, subcellular localization, and the transcriptional activation function of LcHB2 protein in litchi. (A, B) Effects of girdling plus defoliation (GPD) and treatment with ethephon (ETH) on the expression of LcHB2 in the fruitlet abscission zones (FAZs) and two pedicel regions flanking the FAZs, the apical portion (AP) at the fruitlet side above the FAZ and the basal portion (BP) below the FAZ. (C) Correlation between the cumulative fruitlet abscission rate and the expression level of LcHB2 in the FAZ. Data in (A–C) are means (±SE) from three replicates. Different letters indicate significant differences as determined using Duncan’s multiple range test (P<0.05). The correlation coefficient (r) is significant at *P<0.05. (D) Nuclear localization of LcHB2-GFP in tobacco leaves. Scale bars are 25 μm. (E) Transcriptional activation function of LcHB2 in tobacco leaves, as indicated by the ratio of LUC to REN expression. Data are means (±SE) from six replicates. Significant differences between means were determined using Student’s t-test: * P<0.05, ** P<0.01. (F–H) GUS expression driven by the LcHB2 promoter in transgenic Arabidopsis. (F) GUS expression in the abscission zone at positions 1, 3, 5, 7, and 9 along the inflorescence for proLcHB2::GUS. Position numbers were counted from the first flower with visible white petals at the top of the inflorescence. (G, H) GUS expression in (G) the siliques (turning yellow) and (H) cauline leaves for proLcHB2::GUS. Arrows indicate funiculi (black), replums (red), and valve margins (blue). Scale bars are 100 μm (F, G), and 300 μm (H).

