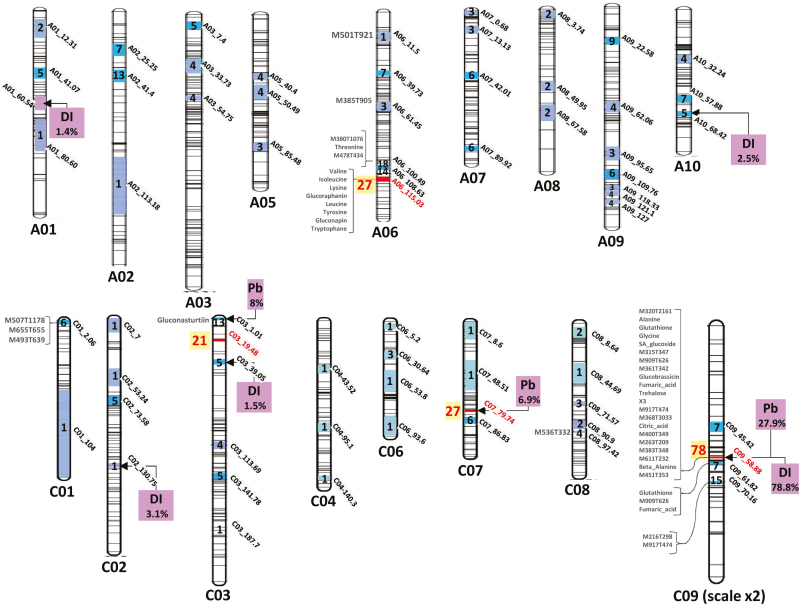
Fig. 5.
Map of QTLs involved in the control of clubroot resistance traits (Pb and DI) and metabolite QTLs (mQTLs) involved in the control of root metabolite contents at 21 dpi. Inside the chromosomes, the confidence intervals (following metaQTL analysis) and the number of overlapping mQTLs (light blue <5, blue <20, red >20) are indicated. At the left side of the chromosomes, mQTLs associated with R2 >20% are indicated. At the right side of the chromosomes, purple boxes indicate QTLs controlling the relative content of pathogen DNA at 21 dpi (Pb; see the Materials and methods for details), and QTLs controlling the clubroot disease index (DI) at 49 dpi. Additional details of individual QTLs are given in the Supplementary data.

