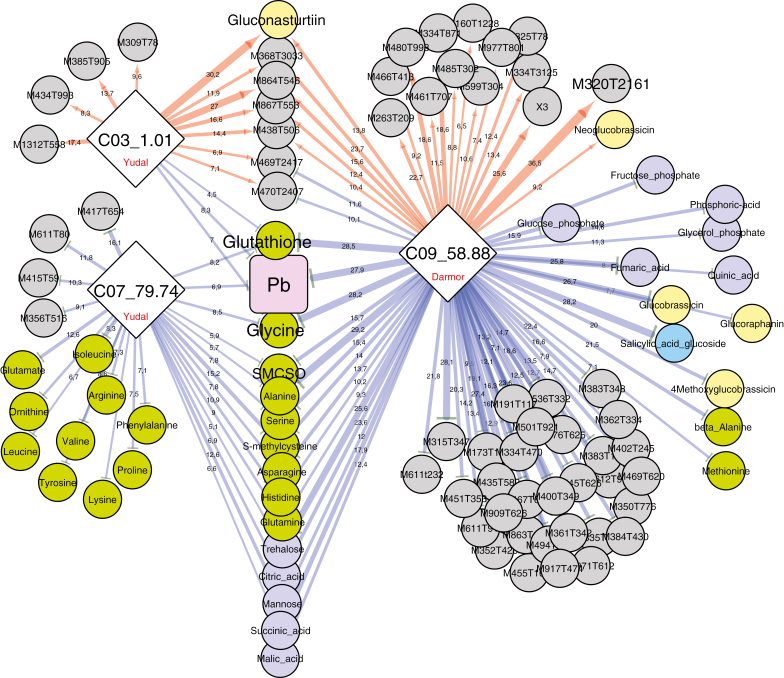
Fig. 6.
Sub-network representing mQTLs connected to the three QTLs involved in the control of the pathogen–plant genomic DNA ratio (Pb) measured at 21 dpi. Nodes represent QTLs controlling the Pb trait (diamonds) and metabolites (circles), and edges represent the partial quantitative effect of metaQTLs on traits. The biochemical category of the metabolites is indicated by the colours of the circles: green, amino acids; pale yellow, glucosinolates; dark purple-blue, sugars, polyols and organic acids; bright blue, hormone-related compounds; grey, non-identified compounds. The width of the edges indicates the quantitative effect of each QTL (R2) for a given QTL. Red and blue edges indicate positive and negative effects, respectively, on trait values (metabolite or Pb), controlled by Darmor or Yudal alleles at each QTL (as indicated in the diamonds).

