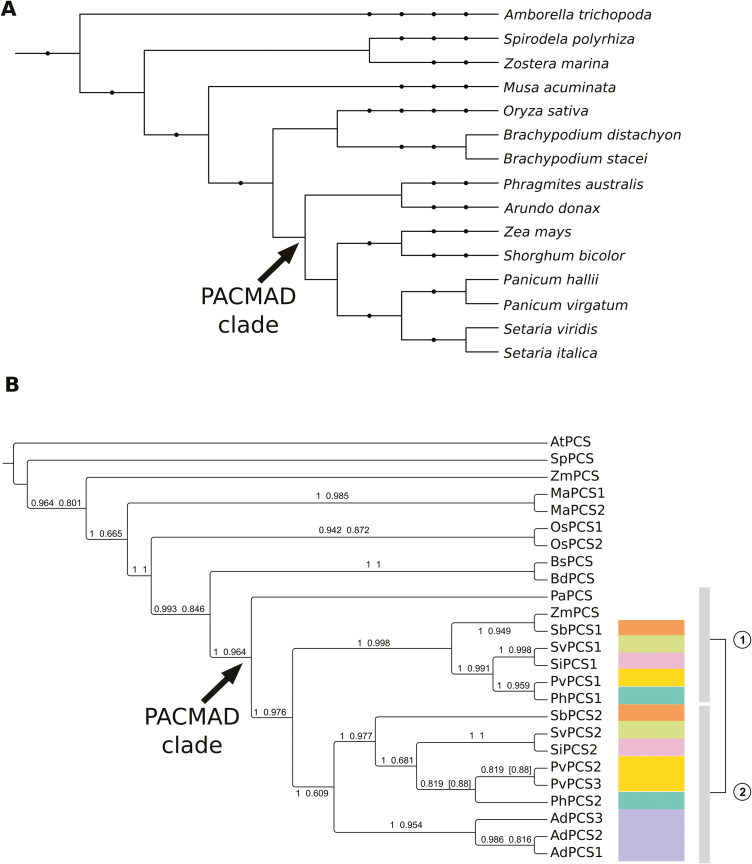
Fig. 2.
Phylogenetic reconstruction of monocotyledonous PCS proteins. (A) Cladogram representing the taxonomy of the species used for phylogenetic reconstruction. Internal nodes indicate high-order taxonomic groups corresponding to NCBI taxonomy. The PACMAD clade is indicated with an arrow. The taxonomic node at the root of the tree is Spermatophyta. (B) Cladogram of the relationships among PCS protein sequences from fully sequenced plant genomes of monocotyledonous species (plus A. trichopoda, the most basal angiosperm species known to date, used here to root the tree) from the Phytozome 12 database. The PCS protein of Phragmites australis, the closest relative of A. donax for which a PCS gene has been functionally characterized, is also included. Phylogenetic reconstruction was carried out with both the BI (MrBayes) and ML (PhyML) methods. The tree reports the BI topology and it is rooted in correspondence of A. trichopoda. Numbers above the branches are Bayesian posterior probabilities (first value) and approximate likelihood ratio test bootstrap supports (second value). Values in square brackets indicate topological differences between methods. The duplication in the PACMAD clade (arrow) is represented by the two vertical bars to the right of the cladogram, each corresponding to a different clade of the duplication. Species with duplicated PCSs in the PACMAD clade are color-coded to simplify identification of duplicates in the tree. The analyzed organisms and the relative abbreviations used in the tree are reported in Supplementary Table S3. (This figure is available in colour at JXB online.)

