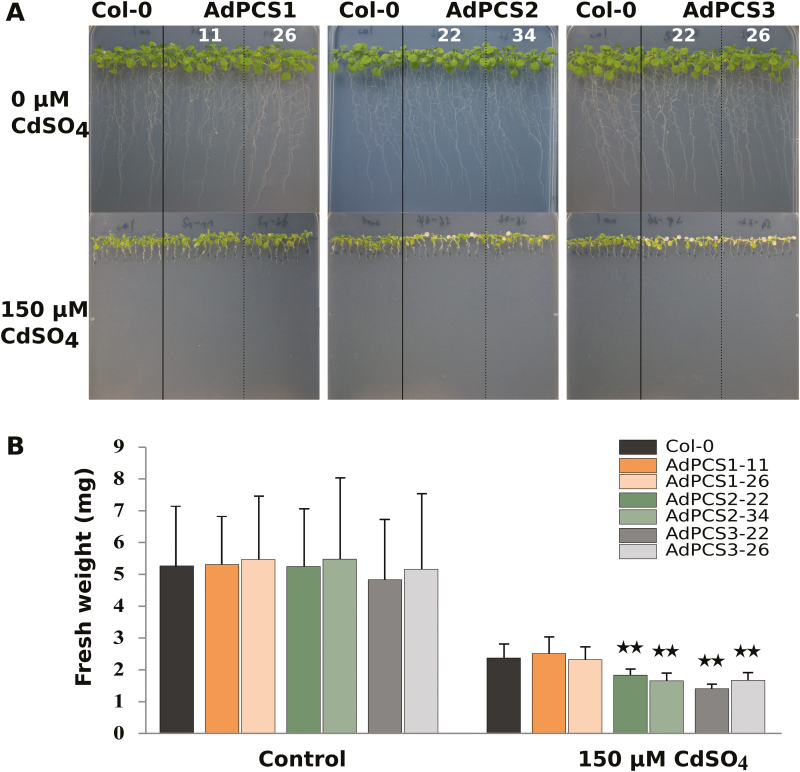
Fig. 5.
Phenotype of A. thaliana plants overexpressing AdPCS1-3 in the presence of Cd. (A) Phenotype of two independent transgenic lines per construct and the control untransformed line (Col-0) grown on vertical plates for 10 days without (top) or with (bottom) the addition of 150 µM CdSO4. (B) Fresh weight of the plants shown in A. Bars indicate the SD of n=3 biological replicates; asterisks indicate statistically significant differences from the untreated controls (P<0.05, t-test corrected with false discovery rate). (This figure is available in colour at JXB online.)

