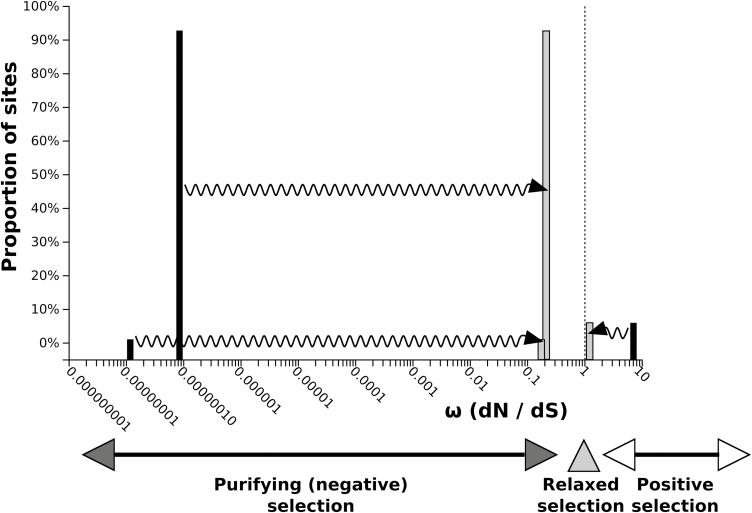
Fig. 8.
Relaxation of selective pressure acting on AdPCS1 and AdPCS2. The distribution of ω (omega ratio of non-synonymous to synonymous substitution rates) across alignment sites is shown by the black bars for the null model in which the same ω distribution is assumed for the AdPCS3 (reference) and AdPCS1-2 (test) branches. The grey bars represent the ω distribution for the alternative model in which different ω distributions are assumed for the reference and test branches. The arrows indicate the direction of ω classes variation from the null model to the alternative model distribution. The shift observed towards ω values closer to neutrality (ω=1, vertical dotted line) indicates relaxation of the selective pressure acting on AdPCS1 and AdPCS2 compared with AdPCS3.

