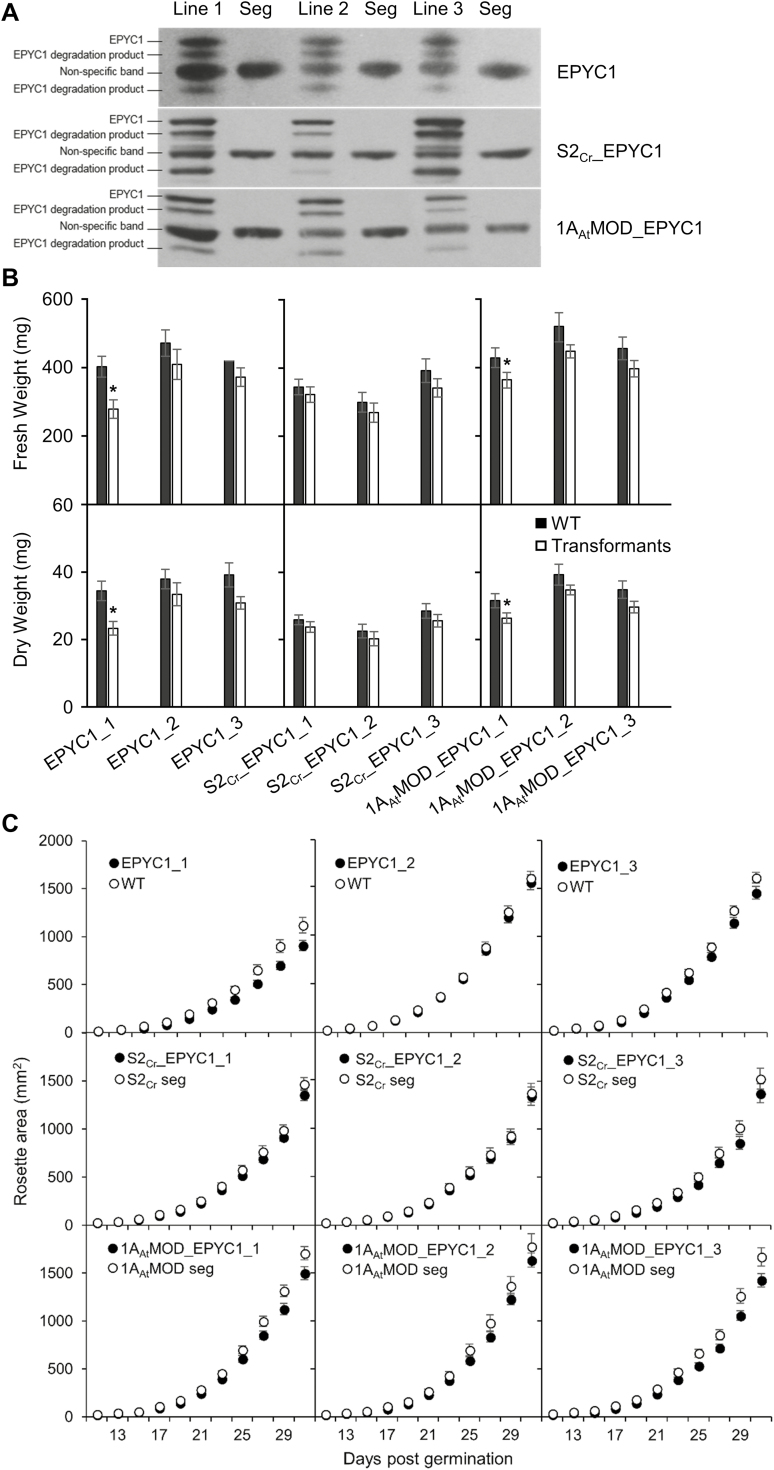
Fig. 6.
Growth of Arabidopsis plant lines expressing EPYC1 fused with the 1AAt-TP in either the wild-type (WT), S2Cr, or the 1AAtMOD background. (A) Immunoblots show the relative EPYC1 expression levels in three independently transformed lines (T3) per background, compared with their corresponding segregants (seg) lacking EPYC1. (B) Plants were harvested at 31 d, and the fresh (FW) and dry (DW) weights were measured. (C) Rosette growth of the nine transformed lines. Values are the means ±SE of measurements made on 12 (FW, DW) or 16 (growth assays) rosettes. Asterisks indicate significant difference in FW or DW between transformed lines and segregants (P<0.05) as determined by Student’s paired sample t-tests.

