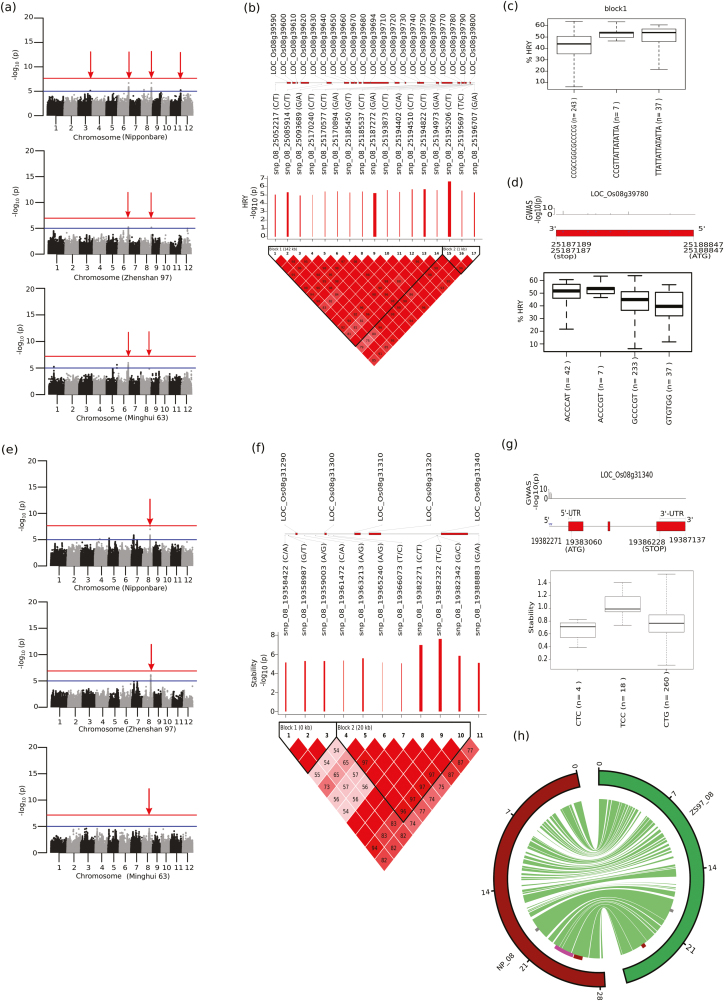
Fig. 3.
Single-locus GWAS for head rice yield (HRY) in control conditions and for moisture stress stability. (a) Manhattan plots for HRY under control conditions using the reference genomes of japonica Nipponbare, and indica Zhenshan 97 (ZS97) and Minghui 63 (MH63). Significant genomic loci (threshold –log10P>5, blue line) for HRY were identified on chromosomes 6, 8, and 11, whilst loci with lower significance were identified on chromosome 3. The loci on chromosomes 6, 8, and 11 (only using the Nipponbare reference) were further confirmed by multi-locus GWAS and are indicated by red arrows. The horizontal red lines represent the genome-wide significance threshold of –log10P = 7.6. (b) Linkage disequilibrium (LD) plot of the 17 tagged SNPs on chromosome 8. Scaled log10(P) values are shown and the red bars indicate a relative negative effect. (c) Haplotypes constructed from LD-block 1 are depicted in boxplots with their phenotypic values for HRY. (d) Haplotypes constructed from all significant non-synonymous SNPs (P≤0.01) present in the candidate LOC_Os08g039780 showed variations for HRY values. (e) Manhattan plot for moisture stress stability showed a significantly associated genomic region on chromosome 8 (5.7Mb away from the HRY peak) using the Nipponbare reference genome, which was confirmed further in the reference genomes of ZS97 and MH63. (f) LD-plot consisting of two LD-blocks showing 11 tagged SNPs in the 30 Kb region; block-2 showed a high-effect SNP from the upstream region of the gene LOC_Os08g31340, constructing haplotypes possessing significant phenotypic variation for stability, depicted as a box plot (g). (h) Circos diagram representing the structural variation and collinearity in chromosome 8 (physical size shown in Mb), between japonica cultivar Nipponbare and indica cultivar ZS97. Significantly associated genomic regions for HRY identified in our study (highlighted as red blocks) and in previous studies (pink block) along with the stability-associated genomic region (grey blocks) are indicated; green stripes indicate conserved regions, while white indicates collinearity breaks in the region.

