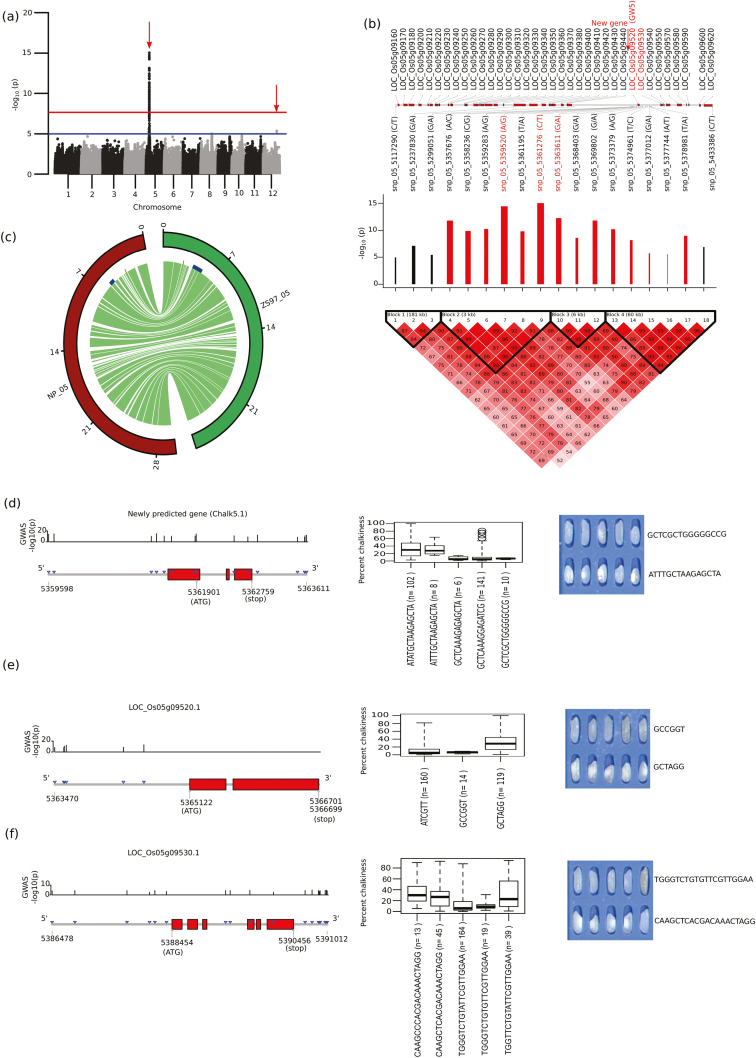
Fig. 4.
Single-locus GWAS for grain chalkiness and prominent loci identified on chromosome 5 in a diversity panel of 320 indica rice accessions using japonica reference genomes. (a) Manhattan plots of the GWAS on percentage grain chalkiness (PGC) shows its association with a chromosome 5 hotspot region and chromosome 12 genetic region (red arrow), which was further confirmed by a multi-locus GWAS. The horizontal red and blue lines represent the genome-wide significant threshold –log10(P) values of 7.6 and 5, respectively. (b) Linkage disequilibrium (LD) plot of the 18 tagged SNPs significantly associated with PGC. A scaled and highly dense LD-based plot within the hotspot genomic region on chromosome 5 is represented. Scaled log10(P) values are shown, and black bars indicate a relative positive effect whilst red bars indicate a relative negative effect. Genes also detected by TGAS are highlighted in red. (c) Circos diagram showing the collinearity in chromosome 5 between Nipponbare and ZS97, particualry within the hotspot region (marked with blue blocks) where the collinearity break is evident, whereas the previously reported gene chalk5 that regulates chalkiness was observed more distantly (small red blocks). (d–f) TGAS of the candidates with their gene structures and haplotypes. (d) The newly detected hypothetical gene (named as chalk5.1); (e) LOC_Os05g09520; and (f) LOC_Os05g09530. SNPs identified in genic region (marked with blue triangles) with their –log10(P) values shown above the gene model. The boxplots show constructed haplotypes and related phenotype distribution for PGC; five selected lines from each of two haplotypes that show extreme phenotype are represented in each case.

