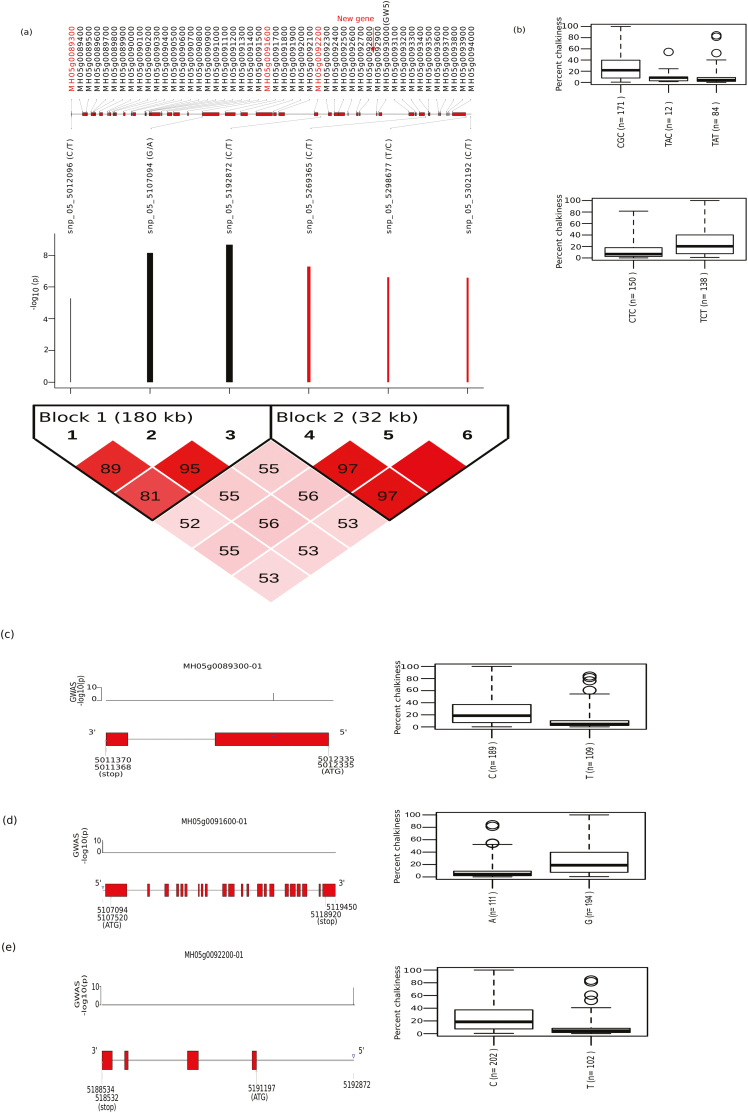
Fig. 5.
Single-locus GWAS for percentage grain chalkiness (PGC) identified a highly associated chromosome 5 hotspot region using Minghui63 (indica) as a reference genome. (a) Linkage disequilibrium (LD) plot of the six tagged SNPs significantly associated with PGC. A scaled and highly dense LD-based plot within the hotspot genomic region is represented and the position of newly predicted gene is highlighted. Scaled log10(P) values are shown for the six SNPs, and black bars indicate a relative positive effect whilst red bars indicate a relative negative effect. (b) Haplotypes constructed within two LD blocks and their respective phenotypic values for PGC are represented as boxplots. (c–e) TGAS of selected genes: (c) MH05g0089300, (d) MH05g0091600, (e) MH05g0092200. These genes are highlighted in red in (a) based on their high effects with respective to PGC values. The boxplots show constructed haplotypes and related phenotype distribution for PGC.

