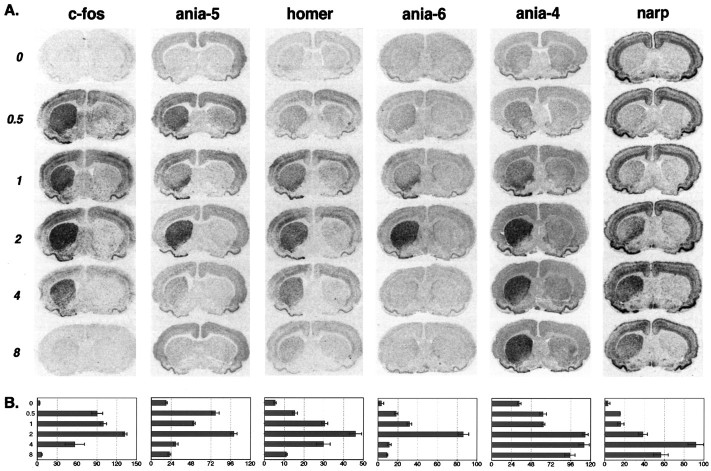
Fig. 4.
Five examples of distinct temporal patterns of gene expression after SKF38393 (5 mg/kg) given to 6-OHDA lesioned animals. Animals were killed at either 0, 0.5, 1, 2, 4, or 8 hr after injection of SKF38393, as indicated. A, Representativein situ hybridization images from each time point. Lesioned side is on the left as in Figure 2.B, Bar charts of average gray value measurements from the dorsal striatum. For each gene, sections from the same four animals were measured at each time point. The x-axis indicates average gray value, in arbitrary units. Error bars indicate SEM.

