
Fig. 2.
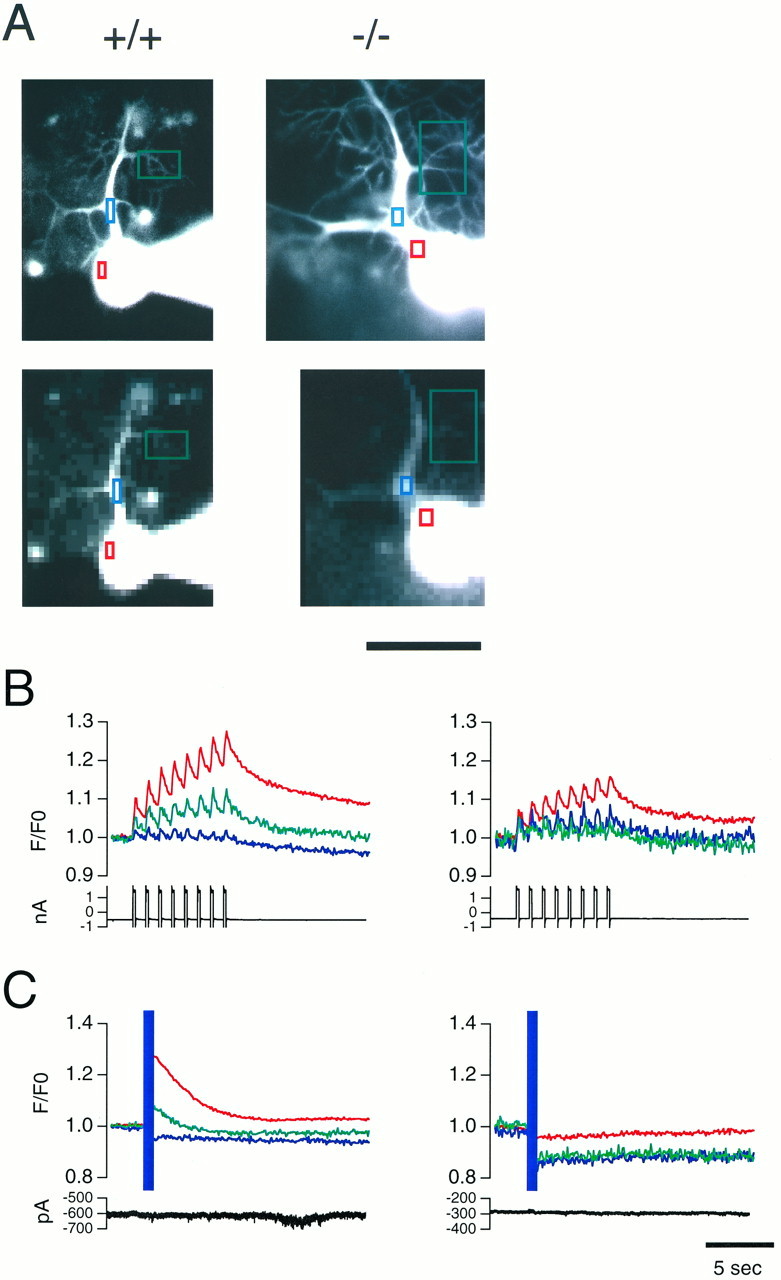
Calcium imaging shows normal Ca2+ transients evoked by depolarization and lack of InsP3-induced Ca2+ release in InsP3R−/− Purkinje cells. A, Morphology of InsP3R1+/+ and InsP3R1−/− Purkinje cells. Colored rectangles indicate regions where time courses of fluorescent changes were plotted. Top panels show fine structures of dendrites with high spatial resolution images. Bottom panels show actual images in which resolution changes in Ca2+ were measured (binning 10 × 10). Scale bar, 50 μm. B, Ca2+ transients were evoked by depolarization pulses. Purkinje cells from InsP3R1+/+ (left) and InsP3R1−/− (right) cerebellum were voltage-clamped at −70 mV and depolarizing pulses (−70–0 mV, 200 msec, 1 Hz, 8 times) were applied to the soma. Fluorescence intensities of indicatedrectangles were averaged, corrected for background, normalized to those from the first frame (resting level), and plotted in the same color as in A. Current traces are also shown at the bottom of the plots. Ca2+transients were observed at proximal (blue) and distal (green) dendritic regions as well as at the soma (red). C, Ca2+ release was induced by photolysis of caged-InsP3 in the InsP3R1+/+ Purkinje cell (left) by UV laser pulses (purple band), whereas no increase in [Ca2+]i was observed in the InsP3R1−/− Purkinje cell (right). Purkinje cells were voltage-clamped at −70 mV; current traces are also shown at the bottom of the plots. Data from the same cells are shown in A–C. Calibration bar, 5 sec.