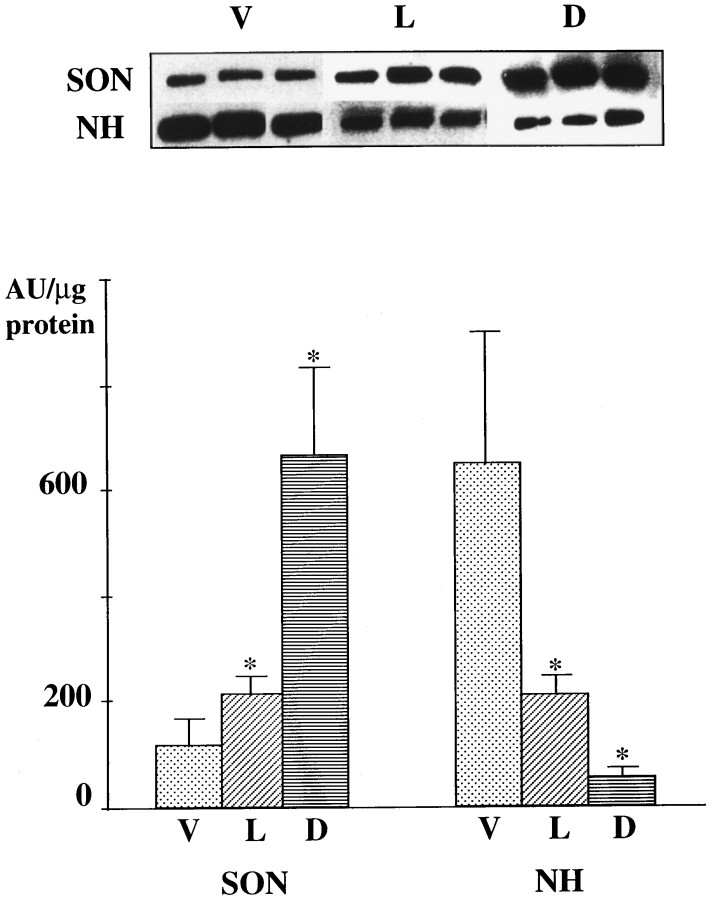
Fig. 4.
Immunoblot analysis of F3 in the supraoptic nucleus (SON) and neurohypophysis (NH) of rats under basal and stimulated conditions of neurohormone release. Immunoreactivities were revealed with peroxidase-conjugated antibodies and chemiluminescence. F3 appeared as a 135 kD band in all tissue extracts (top). In unstimulated virgin rats (V), there is significantly more F3 in the NH than in the SON. Stimulation, either by lactation (L) or water deprivation (D), was accompanied by significant increases in levels of F3 in the SON and significant decreases in the NH. The data were obtained from three different samples of extracts, each representing tissues from three animals under the same experimental conditions per sample. * indicates significantly different from the corresponding values in virgin rats at p < 0.05, Mann–Whitney U test. AU, Arbitrary units.

