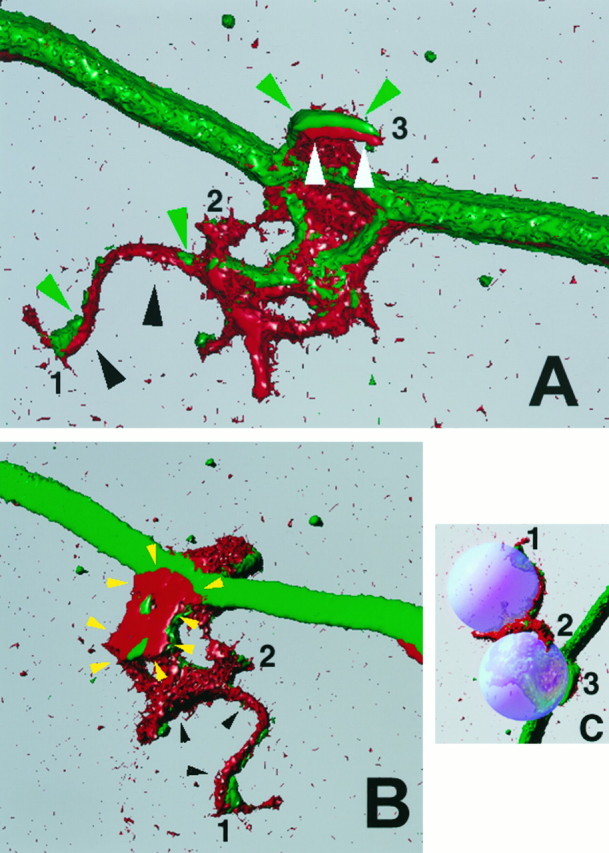
Fig. 4.

Three-dimensional reconstruction of NGF-induced filopodial sprouts. A (view from above the substratum) and B (view from below the substratum) show three-dimensional reconstructions of the sprouting induced by contact of one axon with two separate beads in series. As with the other confocal images, the beads are not stained and were therefore recreated digitally, and their placement is shown in C. The numbers 1–3 in A–C denote individual filopodia contacting the beads and serve as location markers when the three panels are compared. In all panels, red denotes actin filaments and green represents microtubules. The filopodium growing on the bead that was directly contacting the axon (3) is delineated by white andgreen arrowheads in A, and the filopodium growing on the second bead (1), which was not directly on the axon but rested to the side of the axon shaft, is delineated by black and green arrows. Thewhite (A) and black arrows (A, B) denote the surface of the filopodium that was in contact with the bead. Note that the surface of the filopodium that contacted the bead is rich in actin filaments (red). The green arrows point to microtubules that invaded the sprout. Note that the microtubules are more external than the actin with regard the surface of bead–axon interface. In B, the yellow arrowsoutline a portion of the axonal spouting that came to rest underneath the bead closest to the axon. Note that this region is rich in actin and also closely apposed to the substratum. Filopodium number1 had grown a distance of ∼20 μm over the surfaces of the beads. This image was created using Image Volumes v. 2.1 (Minnesota Datametrics, Minneapolis, MN) and a z-series of 56 confocal images (Bio-Rad 1024) obtained using a voxel size of 0.1 μm.
