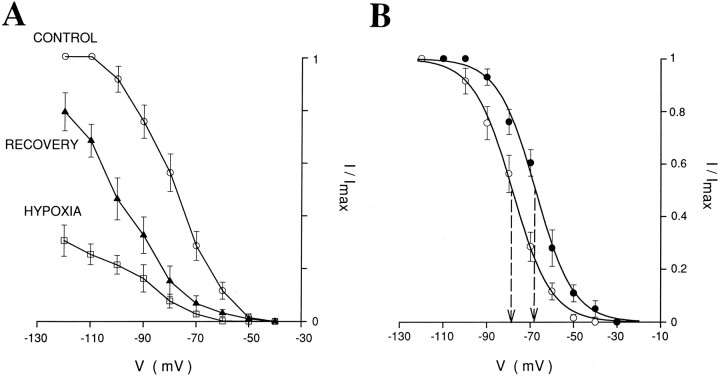
Fig. 4.
Effects of hypoxia on inward relaxations (Ih) and voltage-dependence ofIh and Idif.A, Normalized amplitude of the inward relaxations (Ih) shows the reversible depression produced by hypoxia in eight neurons recorded with Cs+-filled electrodes in the presence of extracellular BaCl2 (1–2 mm), TEA (10–20 mm), and 4-AP (0.1 mm). Error bars represent SEM. The three data sets were normalized usingImax of the control data. B, Normalized activation curve of Ih measured in normoxic conditions (○) and normalized amplitude ofIdif (•) constructed from the same eight neurons as in A. Error bars and curves represent SEM and the Boltzmann curves, respectively (for details, see Materials and Methods). Dashed lines point to theV1/2 of the two curves. Note the similarity in slope and the 10 mV difference in V1/2between the two curves.

