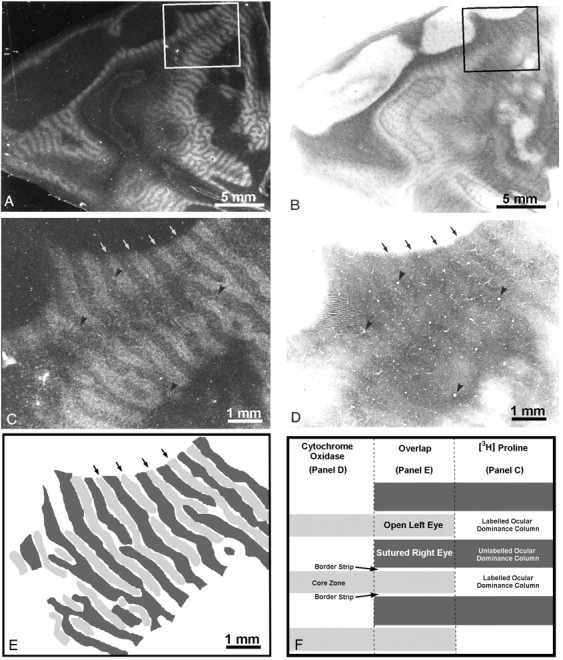
Fig. 4.

Monkey 3 (12 week monocular suture).A, Autoradiograph through the left operculum showing the ocular dominance columns in layer IVc after injection of the left eye at age 15 months. Labeled and unlabeled columns are equal in width.B, Adjacent CO section showing faint columns in layer IVc. Note that the dark columns are much thinner than the pale columns.C, Box in A, showing the ocular dominance columns (arrows) at higher power.D, Box in B, showing matching CO columns (arrows) at higher power.Arrowheads mark blood vessels used for section alignment. E, Drawing comparing the CO section with the autoradiograph. The unlabeled proline columns in C areblack. The dark CO columns in D aregray. Note that the dark CO columns fit in register with the proline columns labeled from the open left eye. However, they are slightly narrower, resulting in a white gap between thegray and black columns in this diagram.F, Diagram summarizing the findings in this animal. Thewhite gap between each gray andblack column in E corresponds to the border strip of the open eye’s (proline-labeled) ocular dominance columns. It measures only ∼30–45 μm. The complete montage of ocular dominance columns in this monkey has been published (Horton and Hocking, 1997b, monkey 8).
