Fig. 1.

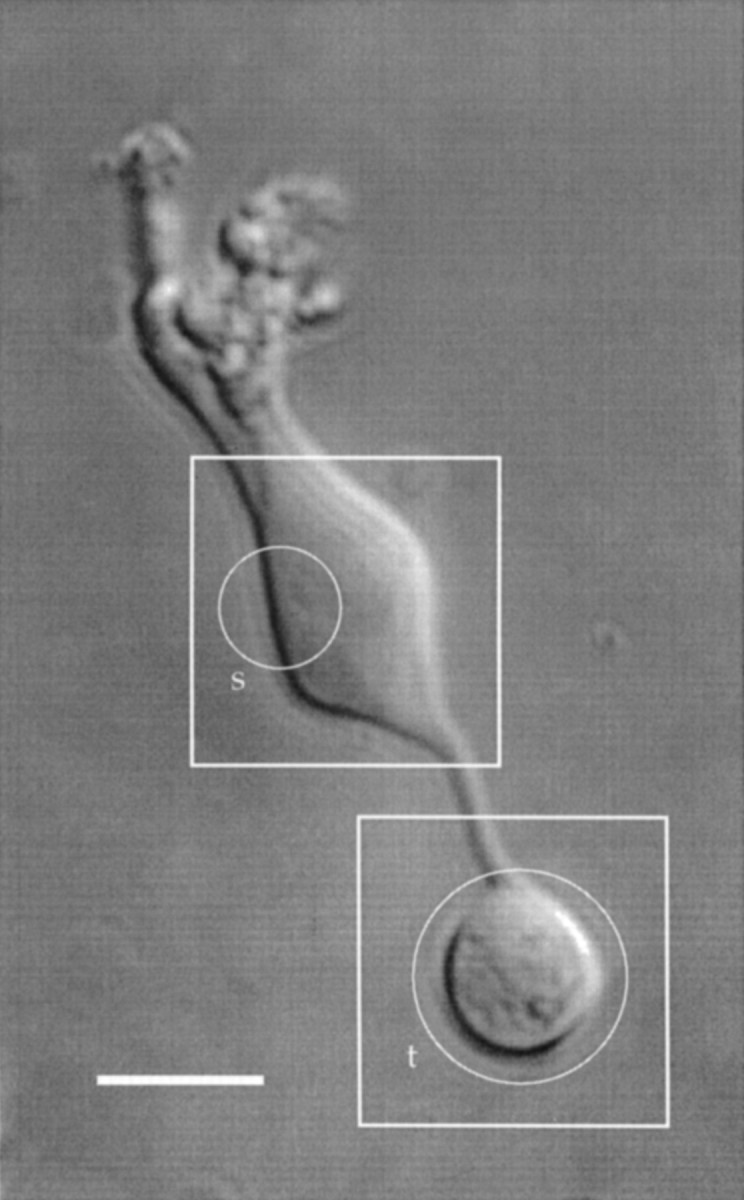
Hoffman modulation micrograph of a solitary bipolar cell. The squares indicate regions of interest that were saved during an experiment. The circlesindicate areas in which the total fluorescence was measured (see text). Scale bar, 10 μm.

Hoffman modulation micrograph of a solitary bipolar cell. The squares indicate regions of interest that were saved during an experiment. The circlesindicate areas in which the total fluorescence was measured (see text). Scale bar, 10 μm.