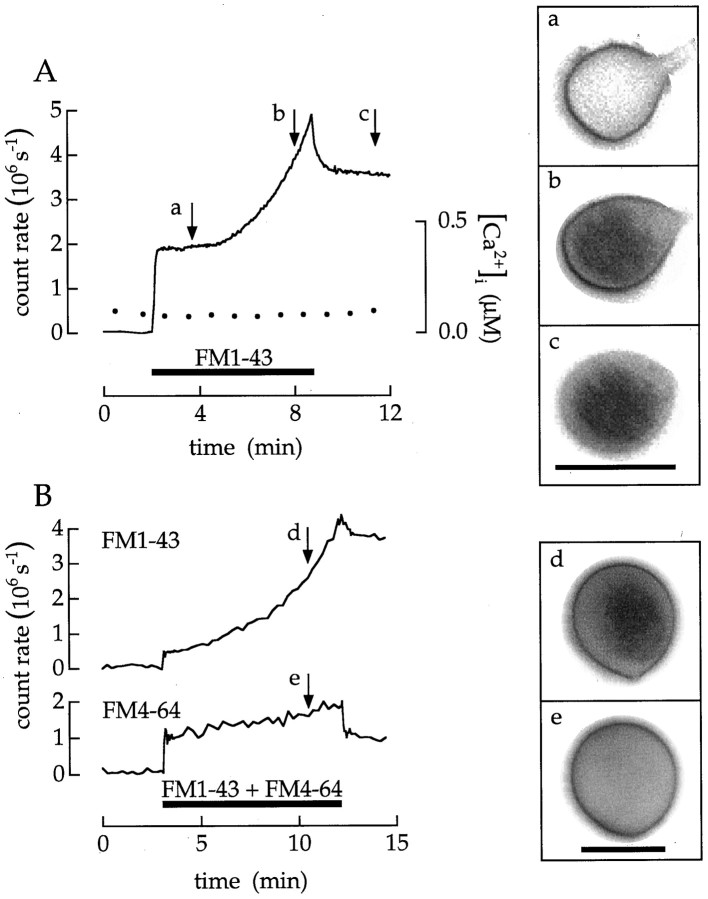
Fig. 14.
Spontaneous entry of FM1–43. A, The cell was continuously superfused with 10 μm ionomycin and 100 nm Ca2+. Intracellular Ca2+ concentration was measured by fura-2 fluorescence (closed circles). The application of 20 μm FM1–43 is indicated by the horizontal timing bar. a–c, The three images at theright were taken at the times indicated byarrows. B, Dye crosses the membrane of a fixed terminal. The cell was fixed with 2% formaldehyde for 1 hr. The application of 15 μm FM1–43 plus 15 μmFM4–64 is indicated by the horizontal timing bar.d, e, The two images were taken at the time indicated by the arrows. Data were corrected for crossover of FM1–43 fluorescence into the FM4–64 detection band. FM1–43 and FM4–64 accumulated in the cytoplasm with different time courses. Scale bars in c and e, 10 μm.

