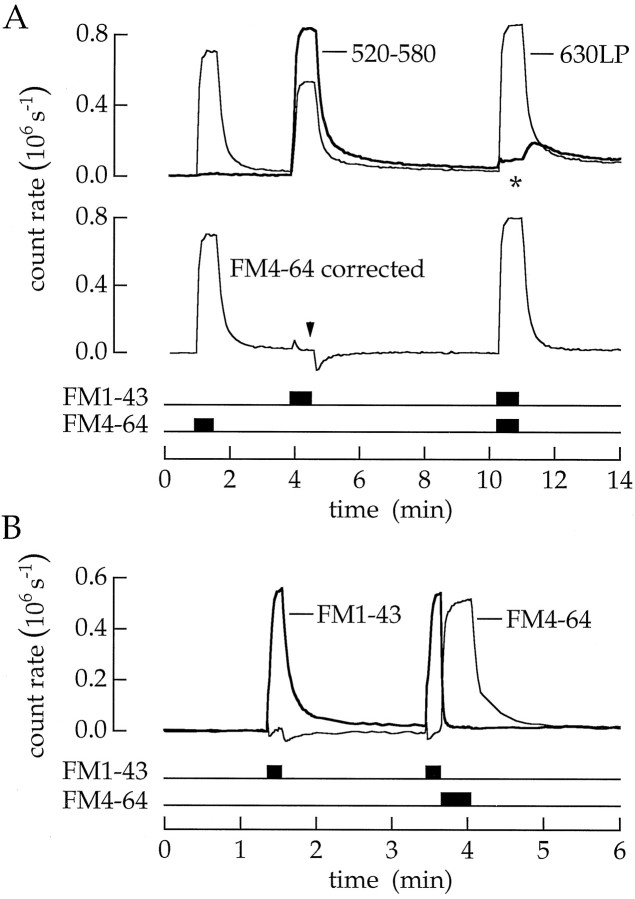
Fig. 3.
FM4–64 quenched FM1–43 fluorescence. Bipolar cells were superfused with 20 μm FM1–43, 20 μm FM4–64, or both dyes together as indicated (superfusions in this and the following figures indicated byhorizontal bars). A, Theupper pair of superimposed traces is the fluorescence measured in the two detection channels. The thick trace is the fluorescence detected between 520 and 580 nm; thethin trace is the fluorescence detected with a 630 nm long-pass filter. When the two dyes are given together, the fluorescence of FM1–43 (asterisk) was less than that when FM1–43 was delivered alone. FM4–64 fluorescence, estimated by subtracting the crossover of FM1–43 fluorescence into the 630 nm channel, is plotted in the lower trace. The small glitches in the corrected trace (arrowhead) are produced because two spectral components of FM1–43 fluorescence leave the membrane at different rates. The time constants for FM1–43 destaining are 6.7 sec (thick trace) and 3.5 sec (thin trace). B, FM4–64 can be used to improve the resolution of membrane destaining. The thick trace is the intensity for emission between 520 and 580 nm. When FM1–43 was delivered alone, the time constant of membrane destaining was 6.7 sec. When FM1–43 was followed by a pulse of FM4–64, fluorescence of FM1–43 in the surface membrane disappeared in <1.4 sec.

