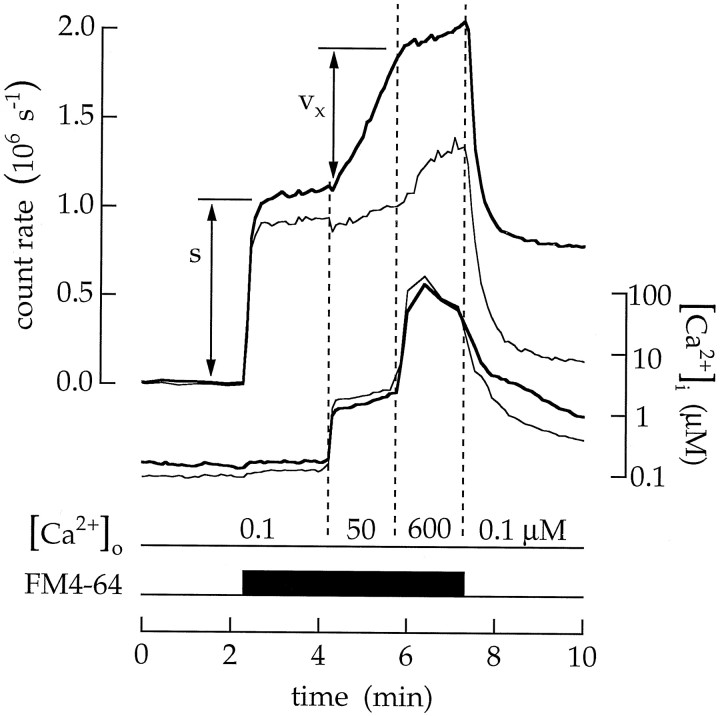
Fig. 4.
Continuous exocytosis is stimulated by a low Ca2+ concentration and inhibited by a high Ca2+ concentration. Cells were continuously superfused with salines containing 10 μm ionomycin. The fluorescence intensity produced by 20 μm FM4–64 is plotted by the upper set of traces; the intracellular Ca2+ concentration is plotted by thelower set of traces. Thick traces in this and the following figures were measured in the terminal; thin traces were measured in the soma. Continuous exocytosis was measured as Cx = ρvx/s Δt. Salines containing 100 nm, 50 μm, and 600 μm extracellular Ca2+ were applied as indicated by the dashed vertical lines. Ca2+ concentrations below 10 μm were reported by fluo-3; concentrations above 10 μm were reported by mag-fura-5. Increasing the intracellular Ca2+ from 0.09 to 1.7 μm increasedCx to 0.33 MEq min−1. A further rise in the intracellular Ca2+ to between 50 and 140 μm reduced Cx to 0.06 MEq min−1.

