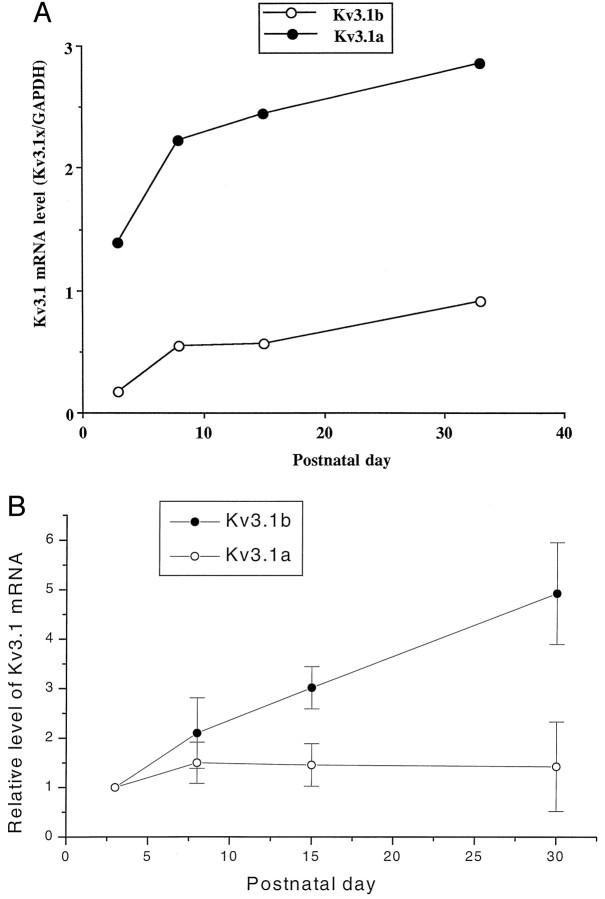
Fig. 1.
Expression levels of Kv3.1a and Kv3.1b mRNA during development. A, The intensities of the Kv3.1a band determined by densitometric measurements were multiplied by 3.6 to account for the differences in the number of labeled C residues in the protected bands of Kv3.1a and Kv3.1b, as described previously (Perney et al., 1992). The levels of the Kv3.1a and Kv3.1b mRNA are normalized by the total amount of GAPDH mRNA. Each point is the mean of two measurements from one experiment. B, Normalized expression levels of Kv3.1a and Kv3.1b mRNA. The Kv3.1a and Kv3.1b mRNA levels determined from the average of two or three measurements for each RNA preparation at each developmental stage were divided by the mean values for these mRNAs at P3 determined in the same experiment. Data are mean ± SEM. n values (numbers of independent RNA preparations) at P3, P8, P18, and P30 are 3, 3, 2, and 2, respectively. The changes in the Kv3.1b mRNA levels are significantly different by ANOVA testing among these age groups, withp < 0.01. A Tukey–Kramer multiple-comparisons test showed that the change in the Kv3.1b mRNA expression at P30 was significantly different from that at P3 and P8, with p < 0.01 and 0.05, respectively.

