
Fig. 4.
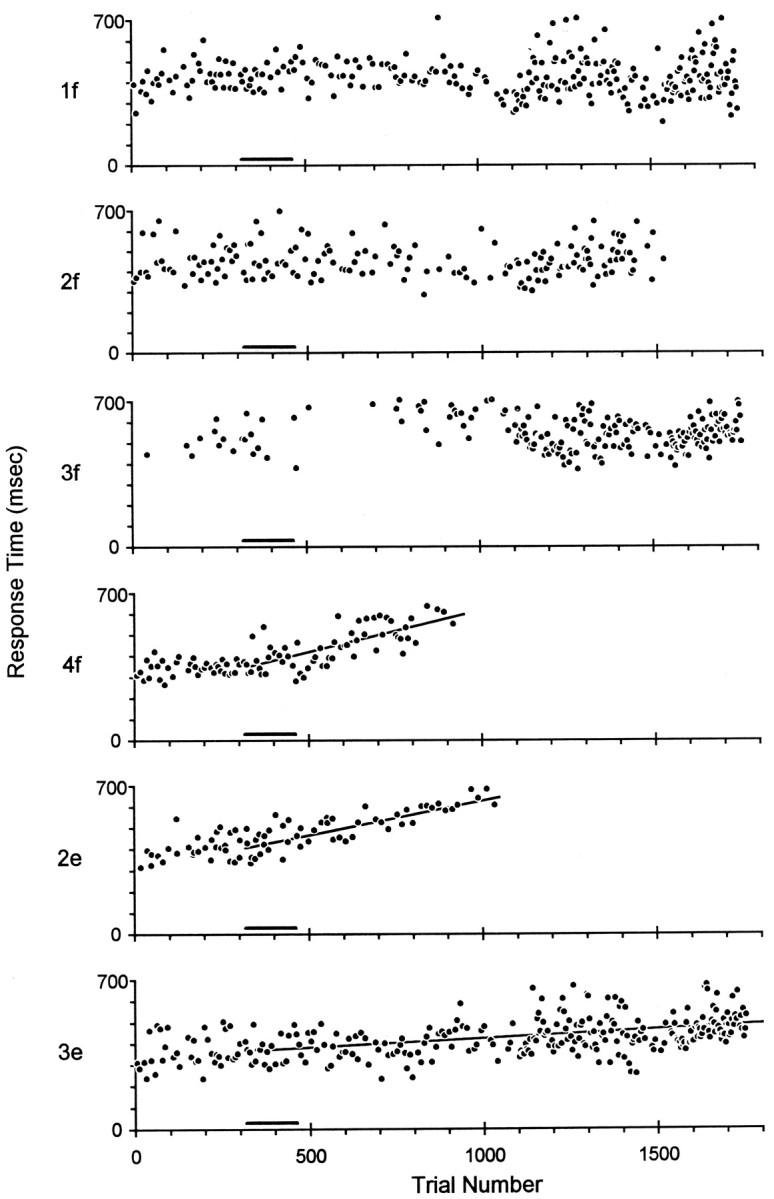
Prolongation of response times. The response times, from cue onset to switch closure, on successful trials have been sorted according to instructed movement (1f, 2f, 3f, 4f, 2e, and 3e) and plotted as a function of sequential trial number in session 50. Muscimol was injected as monkey A performed trials 317–462 (black bar beneath each plot). Subsequently, response times became progressively longer in trials of 4f, 2e, and 3e, and linear regression showed slopes significantly different from zero, whereas response times in trials of 1f, 2f, and 3f remained stable. Shortly before 1000 trials, monkey A became unable to perform 4f and 2e, and these instructed movements were removed from the rotation, making subsequent trials of 1f, 2f, 3f, and 3e relatively more frequent. The total elapsed time in session 50 was 72 min, and the injection was performed over 5 min.