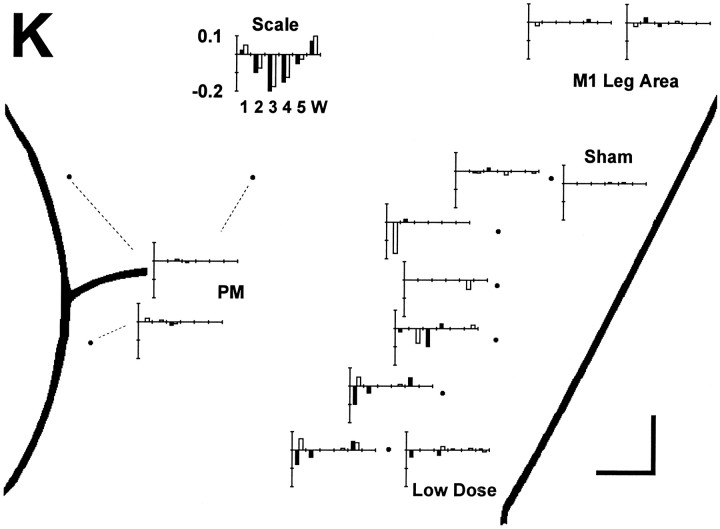
Fig. 7.
Individuation Index changes in each session in monkey K. A bar graph for each session in monkey K is used to show which instructed movements had progressive changes in Individuation Index with slope significantly different from zero. Bar graphs are positioned and formatted as in Figure 3, but here the height of each bar indicates the slope of the best-fit line of Individuation Index versus trial number, in Individuation Index units per 1000 trials. The scale at top thus would illustrate an idealized result in which an injection placed centrally in the hand area caused the greatest Individuation Index decrease for movements of the middle finger and less for index and ring finger movements, whereas Individuation Indexes of thumb and wrist movements increased. Such a result was not obtained, however. Rather, different muscimol injections impaired individuation of some instructed movements but not others in any given session. Which movements were affected showed little relation to the location of the injection along the central sulcus.

