
Fig. 6.
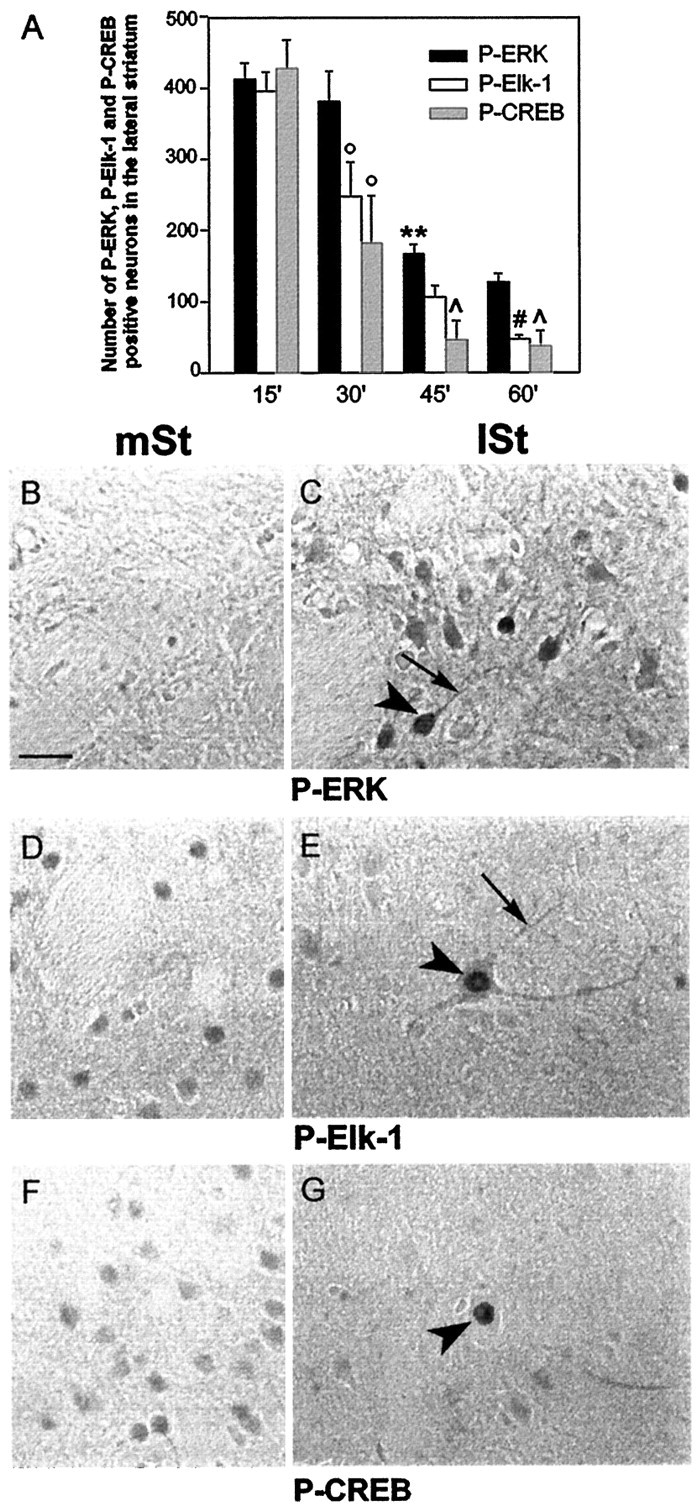
Inactivation of ERK, Elk-1, and CREB after 60 min of corticostriatal stimulation. A, Quantification of P-ERK, P-Elk-1, and P-CREB immunoreactive striatal cells at 15, 30, 45, and 60 min of corticostriatal stimulation (n = 3 rats for each stimulation period). Cells counts were performed with an image analyzer (Biocom) in the lateral striatum ipsilaterally to the stimulation (total surface area examined, 2.7 mm2). Statistical comparisons were performed with a one-way ANOVA. **p < 0.01 when comparing P-ERK immunostaining between 45 and 30 min; °p < 0.05 when comparing P-Elk-1 and P-CREB immunostaining between 15 and 30 min; p < 0.05 when comparing P-CREB with P-ERK at 45 and 60 min; #p < 0.05 when comparing P-Elk-1 with P-ERK at 60 min. Adjacent brain sections of 60-min-stimulated rats were processed in parallel for P-ERK (B, C), P-Elk-1 (D, E), and P-CREB (F, G) immunohistochemistry. In the lateral striatum (lSt) few P-ERK immunoreactivecells were found (C) when compared with those in Figure 4D. These cells presented both nuclear (arrowhead) and cytoplasmic (thin arrow) staining. E, Very few large neurons remained immunolabeled for P-Elk-1 in the lSt when compared with those in Figure 4H. Here again, the labeling was detectable in the nucleus (arrowhead) as well as in the cytoplasmic compartments (thin arrow). Similarly, CREB hyperphosphorylation (G) occurred in the nucleus of very few cells (arrowhead). Note that the constitutive immunolabeling observed in the medial striatum (mSt) for P-Elk-1 (D) and P-CREB (F) is no longer detectable in thelSt (E and G, respectively). Data are representative of three independent 60-min-stimulated rats. Scale bar, 1 cm = 15 μm.