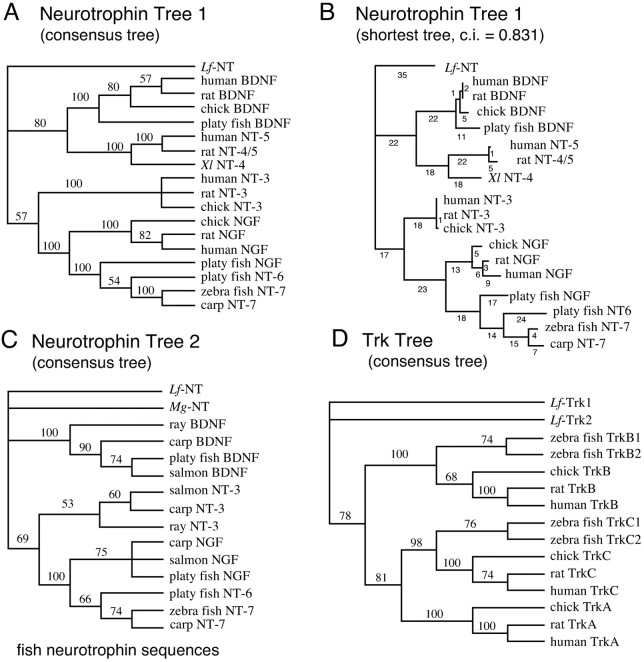
Fig. 2.
Phylogenetic trees generated with neurotrophin and Trk receptor amino acid sequences. A,Neurotrophin Tree 1, Consensus tree based on a matrix with the mature neurotrophin amino acid sequences from representative species including human, rat, chicken, and lamprey. B, One of the shortest trees from the search giving the consensus tree inA. Branch lengths are indicated below branches.C, Neurotrophin Tree 2, Consensus tree based on a matrix with fish neurotrophin amino acid sequences.D, Trk Tree, Consensus tree based on a matrix with Trk receptor sequences including Lf-Trk1 and -Trk2. The depicted consensus trees are bootstrap consensus trees and were generated using PAUP v.3.1.1 from 500 unrooted branch-and-bound replicates of the most parsimonious trees, with sampling excluding uninformative characters. Bootstrap percentages are indicated on branches in the tree and indicate how often a particular branch was found in the bootstrap analysis. If a branch is found in <50% of the trees it is collapsed into a polytomy. The consensus trees show the relations between the taxa, and branch lengths in those trees do not reflect distances between taxa. The shortest trees found when analyzing the matrices had high consistency index (CI) values indicating a low degree of homoplasy (CI tree 1 = 0.831, tree 2 = 0.829, and Trk tree = 0.844).

