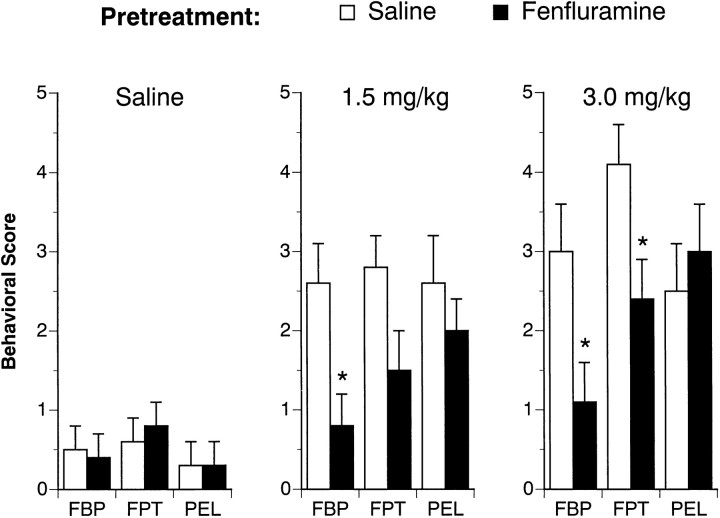
Fig. 6.
FEN-induced behavioral responses evaluated 2 weeks after the 4 d saline or FEN-dosing regimen. The data depicted here are obtained from the same subjects described in Figure 5. Refer to the legend of Figure 5 for further details. n = 8 rats per group. *p < 0.05 with respect to corresponding saline pretreatment group.

