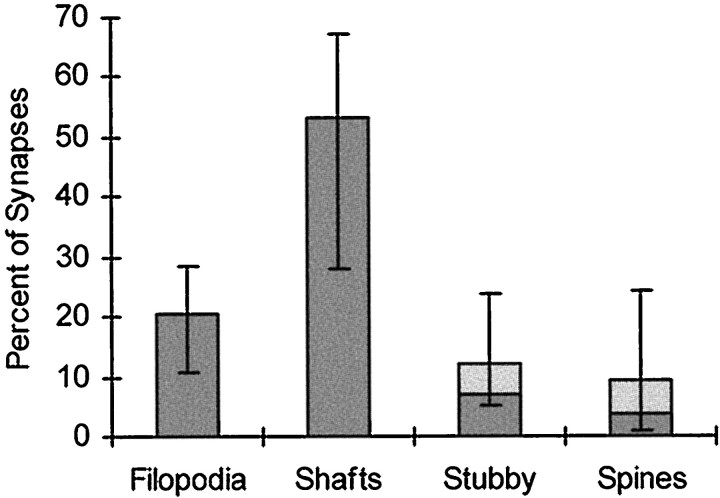
Fig. 10.
Distribution of synapse locations in CA1 during the first postnatal week. Bars represent the mean percentages of synapses in each class. Light shading indicates mean percentages for atypical spines and stubbies (see Materials and Methods for details). Error bars show the minimum and maximum values for combined means measured in 12 series from seven animals aged P1, P4, and P6.

