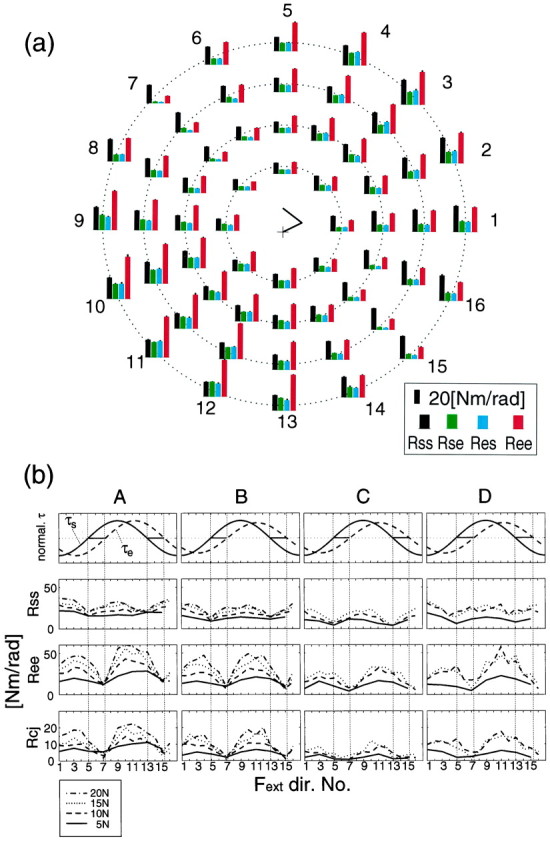
Fig. 6.

a, Joint stiffness values (Rss, Rse,Res, Ree) during force regulation tasks without cocontraction (instruction) at a proximal hand position (subject A). The stick picture in the center of the a shows the arm configuration (+ denotes shoulder position). Bar graphs were aligned in a polar manner according to force directions and magnitude (Fig. 10,arrows). The eight bar graph sets placed in the innermost circle represent the stiffness values during force regulation tasks at 5 N in the eight directions. Similarly, 16 bar graphs placed on the second, third, and fourth circular positions from center to outside represent those during force regulation tasks at 10, 15, and 20 N in each direction, respectively. The error bar on each bar represents SD of the corresponding estimate. b, Changes in joint torque and joint stiffness values according to the force directions of all four subjects. In the top row,solid and dashed lines represent shoulder and elbow normalized joint torque, respectively. In the second to fourth rows, lines represent each stiffness component (Rss, shoulder; Ree, elbow; Rcj = (Rse +Res)/2, cross-joint) during force regulation tasks with 5 (solid line), 10 (dashed line), 15 (dotted line), and 20 N (dash-dot line). The numbers on the abscissa denote the force directions applied to the handle (see also Fig. 10a).
