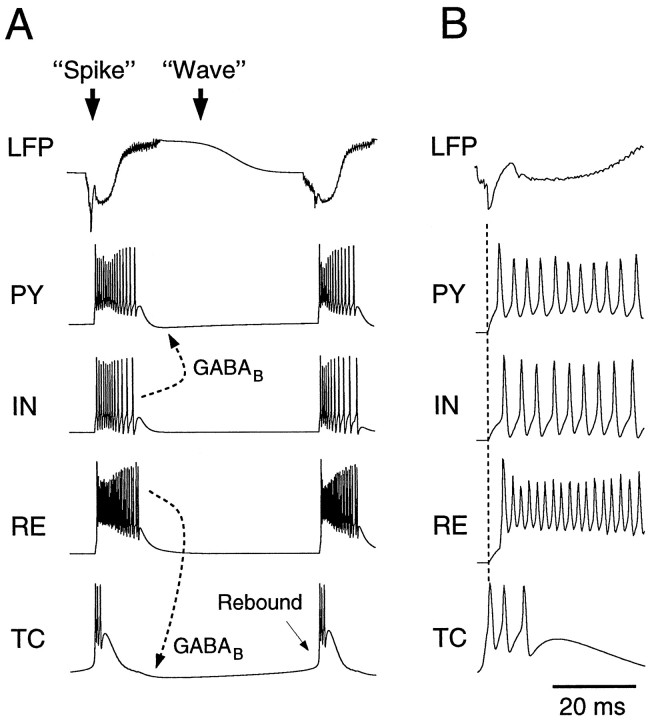
Fig. 8.
Phase relations during simulated spike-and-wave discharges. A, Local field potentials (LFP) and representative cells of each type during SW oscillations. Spike, All cells displayed prolonged discharges in synchrony, leading to spiky field potentials.Wave, The prolonged discharge of RE andIN neurons evoked maximal GABAB-mediated IPSPs in TC and PY cells, respectively (dashed arrows), stopping the firing of all neuron types during a period of 300–500 msec and generating a slow positive wave in the field potentials. The next cycle restarted because of the rebound of TC cells after the GABAB IPSP (arrow). B, Phase relationships in the thalamocortical model. TC cells discharged first, followed by PY, RE, and INcells. The initial negative peak in the field potentials coincided with the first spike in TC cells before the PYcells started firing and was generated by thalamic EPSPs inPY cells.

