
Figure 4.
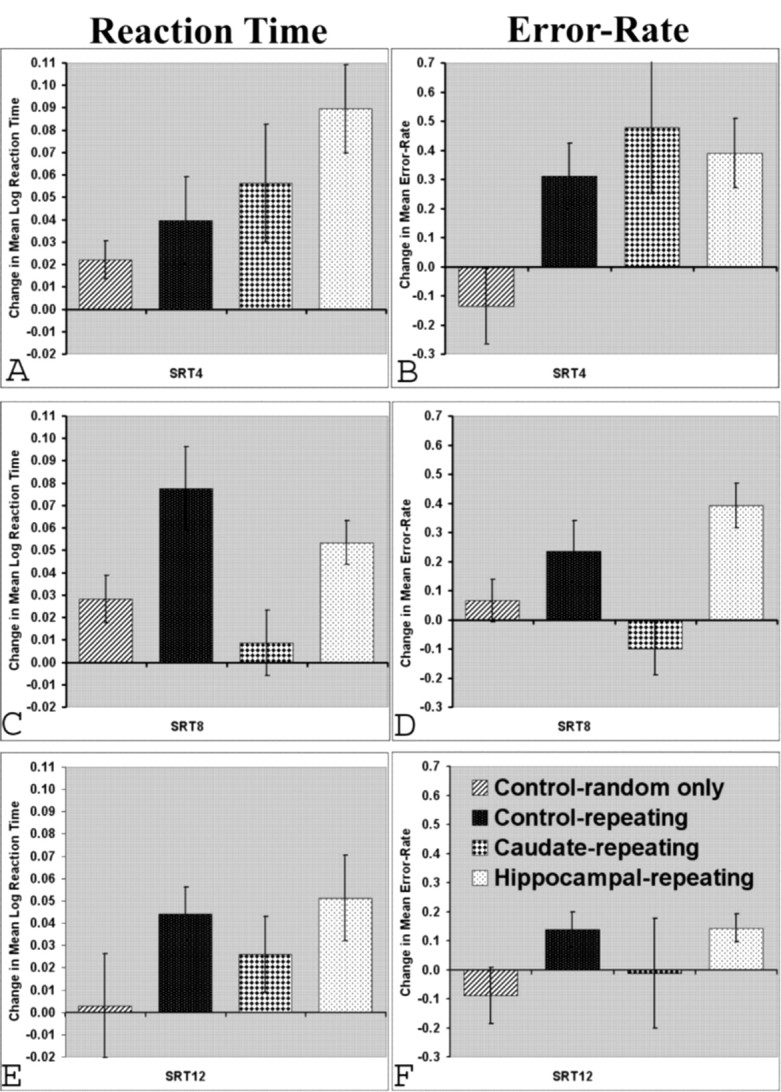
Interference effect (difference) scores for each sequence length condition. Difference scores were generated by comparing the 10 sequences immediately after sequence switch with the 10 sequences immediately before the sequence switch. Positive scores indicate a deterioration in performance. Error bars represent ±1 SEM.