
Figure 4.
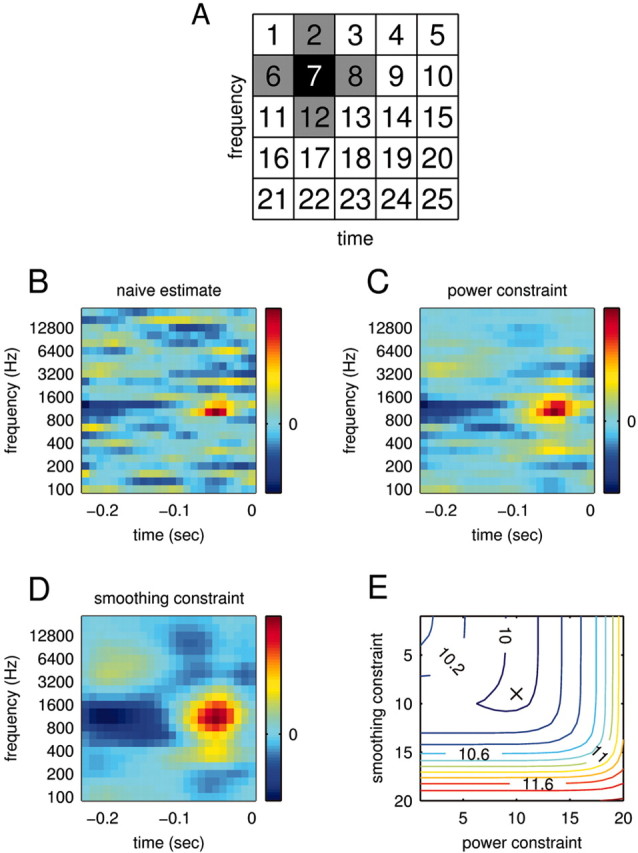
STRF estimation. To estimate a relationship between stimulus and response, we computed the STRFs of the recorded neurons. To circumvent estimation problems deriving from the usage of natural stimuli, we subjected the STRF estimation to a smoothing and power constraint. A, Range of smoothing constraints. The smoothing constraint enforces that the values of neighboring bins do not deviate too strongly. The neighbors of bin 7, for example, are shown in gray. B, Naive estimate of the STRF via linear regression. An estimate without any constraints achieves a mean square error ϵ = 5.6 mV2 between actual and predicted response on the data used for the STRF estimation (training) and an error ϵ = 10.69 mV2 on new data (prediction). The large difference indicates strong overfitting, which is also visible in the noisy structure of the STRF. C, Optimal estimate of the STRF subject to a power constraint. Here, the power constraint was chosen to minimize the prediction error. Indeed, whereas the training error increases (ϵ = 6.95 mV2), the prediction error is now considerably lower (ϵ = 9.97 mV2). D, Optimal estimate of the STRF subject to smoothing constraint. Both training error (ϵ = 7.08 mV2) and prediction error (ϵ = 10.01 mV2) are similar to those for the power constraint. E, Prediction error for different combinations of smoothing and power constraints. For this cell, combining the two types of constraints does not significantly enhance the prediction success. The absolute minimum (ϵ = 9.97 mV2) is denoted by the black cross. The STRFs inside the trough (blue contours) are therefore equally valid estimates; showing the “extremes” in C and D allows an assessment of the robustness of the estimates.