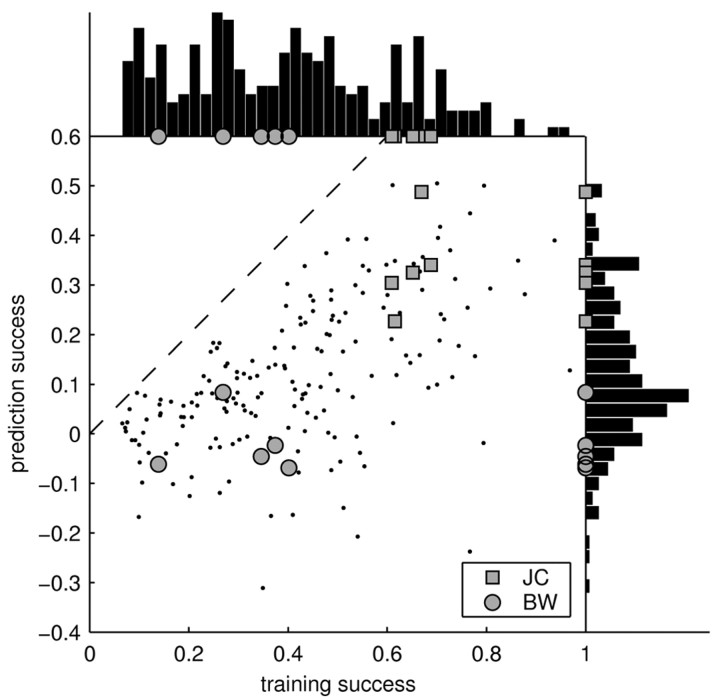
Figure 6.
Summary of training and prediction success. Each point in the main panel represents the success of the STRF model in estimating the response to an individual stimulus (15 sec). For the training success (x-axis), the same individual stimulus was used for both estimating and testing the STRF. For the prediction success (y-axis), the STRF was tested on the individual stimulus but trained on all others. To permit the individual points on the graph to be resolved, only a subset of the stimuli (n = 10; chosen randomly for each neuron) is shown. Although the prediction success provides a lower bound on the capability of the model to estimate the response, the training success yields an upper bound. Surprisingly, some of the stimuli are consistently better than others across neurons [compare JC (squares) and BW (circles)]. Hence, the STRF is able to capture a significant part of the response to some stimuli, yet it fails to predict the response to others. The distribution of training and prediction success is displayed as a histogram on the top and the right, respectively. Averaged over all stimuli and cells, the training success was 39%, and the prediction success was 11%. Hence, the responses of cortical neurons to natural stimuli are dominated by nonlinearities.

