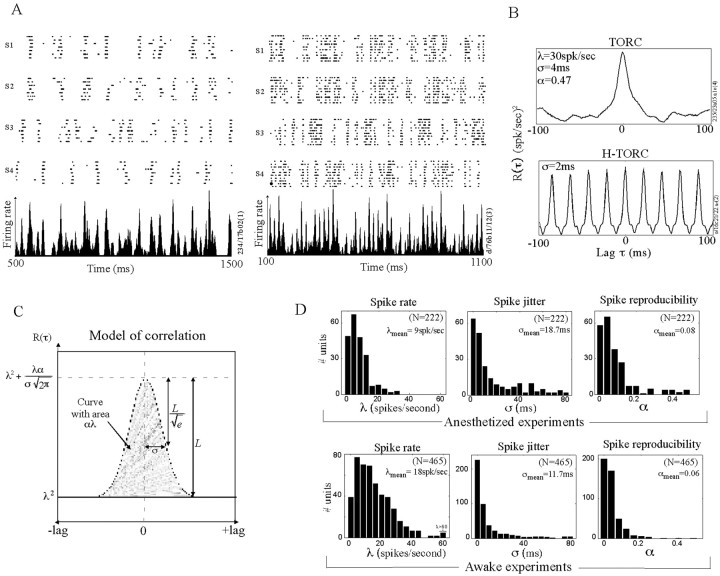
Figure 2.
Analysis of spiking precision in A1. A, Rasters of responses of single units in A1 of an anesthetized (left) and awake (right) animal. Each raster depicts repeated responses to four different TORC stimuli. The bottom panels depict the PSTHs computed by averaging the responses to repetitions of all TORC stimuli presented to that neuron. The precision of the time of occurrence of spikes can be judged by their vertical alignment. The PSTH contains frequent large peaks, indicating the occurrence of spikes at those instants in response to many of the TORCs. The TORCs in the right panel are composed of harmonically related tones (H-TORCs) with a fundamental frequency of 48 Hz. Therefore, the PSTH displays regular peaks locked to the 48 Hz fundamental. B, Correlation function of the responses shown in A for regular (top) and harmonic (bottom) TORC, respectively. C, Model of the expected correlation function for a Poisson spiking neuron. The model is used to estimate spiking jitter (σ), spike reproducibility (α), and average firing rate (λ) in the neuronal response. D, Distribution of correlation model parameters. The histograms are population distributions for average spike rate (λ), spike jitter (σ), and reproducibility (α), under anesthetized and awake conditions.

