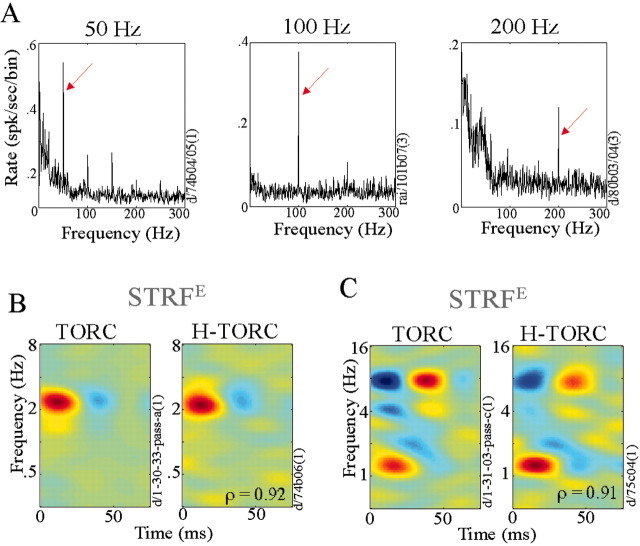
Figure 8.
Harmonic TORC responses. A, Fourier transform of PSTHs of three neurons. Each neuron was tested with a different harmonic series, as indicated by the fundamental frequencies marked by the red arrows. All three neurons exhibit noticeably salient peaks at the fundamental component, and some of the upper harmonics. B, C, STRFEs estimated using regular TORCs (left) and H-TORCs (right) for different neurons. The STRFE pairs are very similar, with correlation coefficients of +0.92 and +0.91. The fine-structure characteristics of the cells shown in B and C are as follows: B, λ = 45.6 spikes/sec, σ = 3 msec, α = 0.2, and ΔPE = 93%; C, λ = 20.3 spikes/sec, σ = 8.5 msec, α = 0.01, and ΔPE = 90%.

