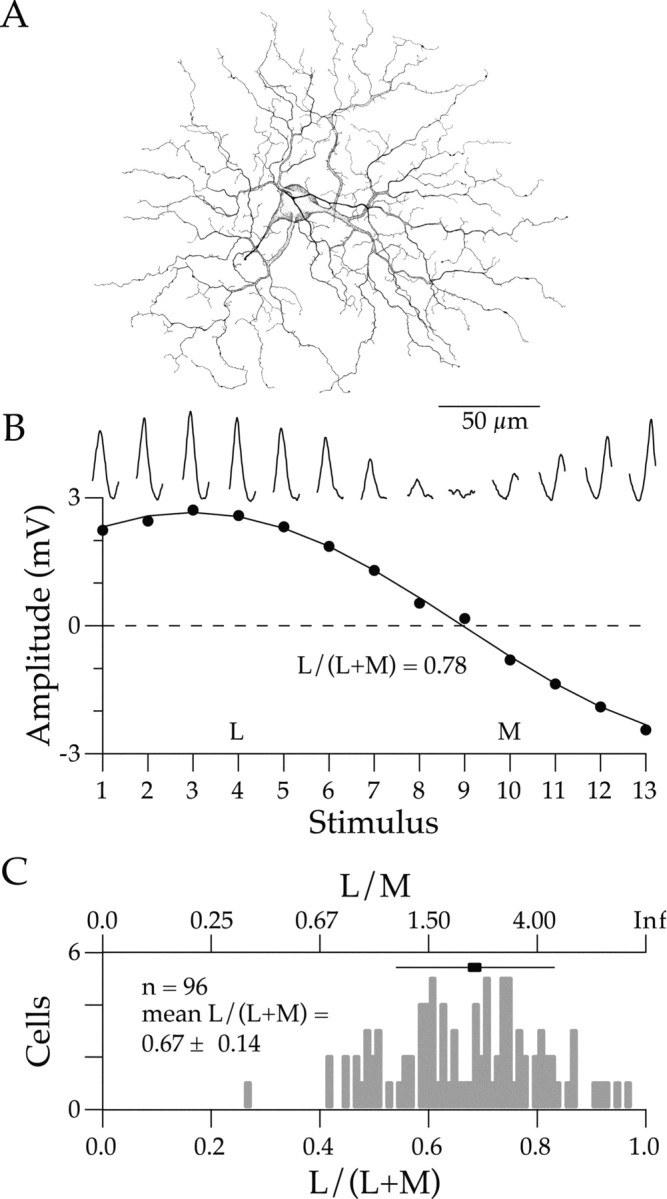
Figure 3.

The relative strengths of L and M cone inputs to parasol ganglion cells. A, A drawing of the dendritic arbor of a peripheral parasol ganglion cell. The scale bar indicates distance in micrometers. B, The traces at the top are the average responses of a parasol ganglion cell to each of the 13 sinusoidal stimuli. The x-axis of each trace is time, and the y-axis is amplitude. Although the axes are not shown, they are identical for all traces. The graph plots fundamental response amplitude as a function of stimulus number. The L and M cone contrasts associated with each stimulus are found in Figure 1. The filled circles represent the average fundamental response amplitude of a parasol ganglion cell to each stimulus. The solid line is the best fit of Equation 1 through the data points. The relative strength of L and M cone inputs L/(L + M) is found by noting the relative L and M contrasts at which the response nulls. The solid curve crosses the x-axis just to the left of stimulus number 9. This corresponds to an L/(L + M) ratio of 0.78. C, Histogram of 96 parasol ganglion cell input ratios measured at a temporal frequency of 9.7 Hz. The top x-axis expresses relative L and M cone input as a simple ratio (L/M). The lower axis expresses relative cone input as a normalized ratio L/(L + M). The center of the horizontal bar is the mean L/(L + M) ratio of the group. The length of the bar represents the SD of the distribution.
