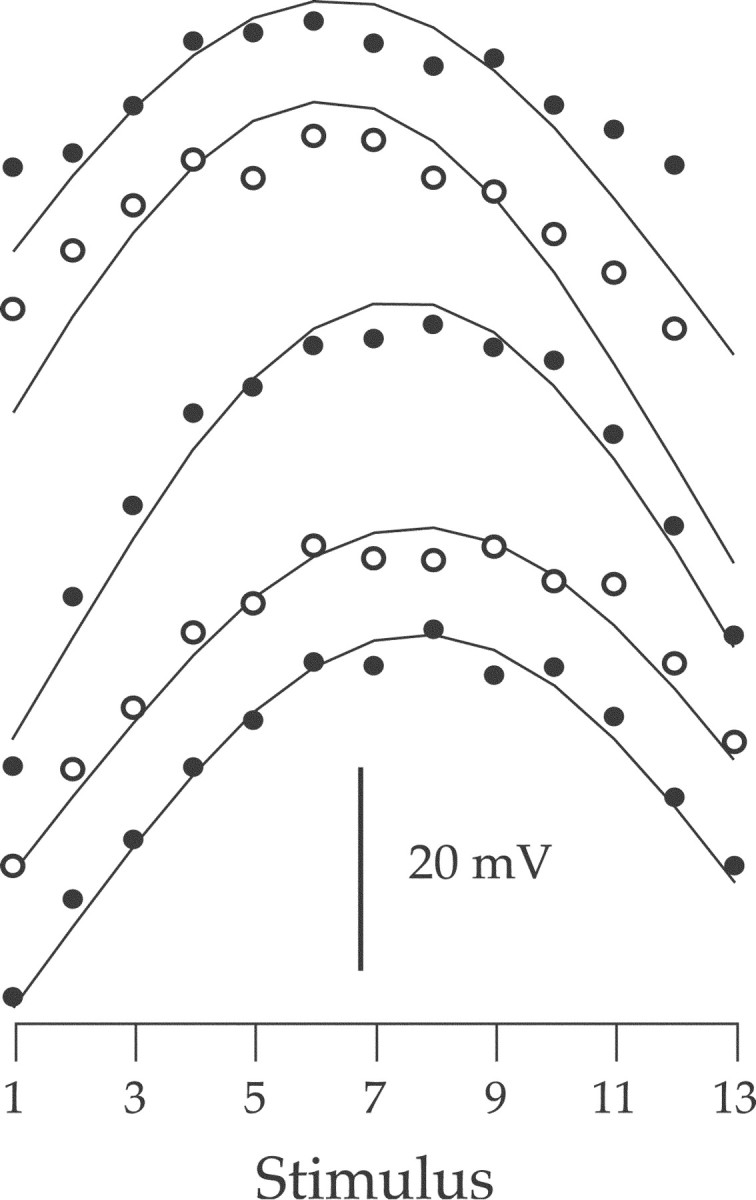
Figure 8.

The responses of a red–green spectrally opponent ganglion cell to the 13 sinusoidal stimuli at a series of temporal frequencies. From the bottom, the temporal frequencies were 1.22, 2.44, 4.8, 9.7, and 15.2 Hz. Each set of filled or open circles are the response amplitudes to the stimuli. Filled and open circles alternate for clarity. Each curve is the best fit of the L and M cone summation model (Eq. 1) to the data points. Each curve and associated data points have been shifted along the y-axis for clarity. The scale bar indicates 20 mV of response amplitude. The ganglion cell type was not positively determined.
