Figure 2.

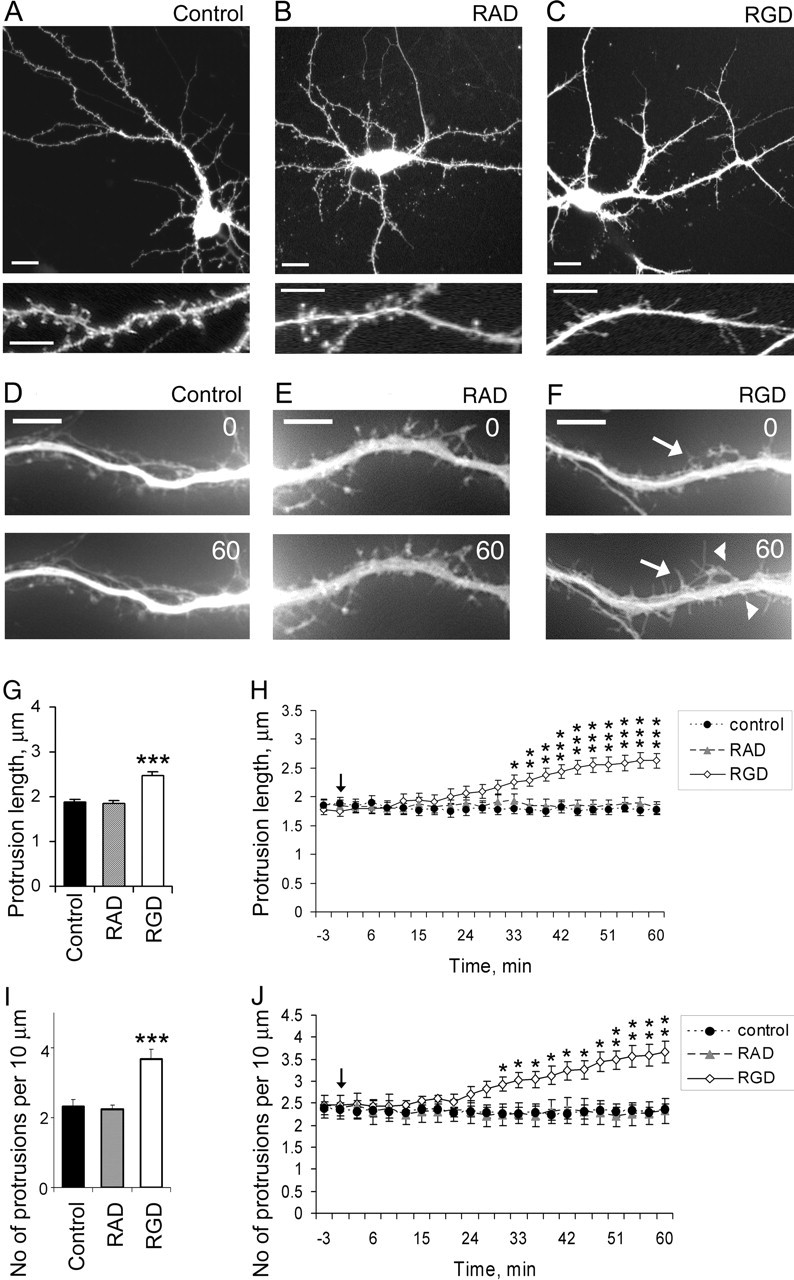
Dendritic spine elongation and new filopodia formation are induced by RGD-containing peptide in 14 DIV hippocampal neurons. A–C, Confocal images of GFP-labeled 14 DIV mouse hippocampal neurons untreated (A), treated with 500 μm control RAD-containing peptide (B), or treated with 500 μm RGD-containing peptide (C). GFP fluorescence was used to visualize dendritic morphology. RGD-treated neurons showed increased number of filopodia-like protrusions and increased length of dendritic spines, whereas neurons treated with control RAD-containing peptide showed no changes in dendritic spine morphology or length. Scale bars: top panel, 10 μm; bottom panel, 5 μm. D–F, Live images of GFP-labeled dendritic spines in 14 DIV hippocampal neurons before (0 min) and after (60 min) treatment with blank (D), control RAD (E), or RGD (F). RGD-treated neurons showed formation of new filopodia (arrowheads) and elongation of existing dendritic spines (arrows). G, H, Quantification of dendritic protrusion length in 14 DIV GFP-labeled hippocampal neurons before and after treatment with blank (control), control RAD, or RGD. G, Dendritic protrusions were significantly longer in RGD-treated neurons. Data represent the mean protrusion length. Error bars indicate SEM (n = 15 neurons per group). H, The time course of the elongation of dendritic protrusions showed a significant increase in mean protrusion length starting ∼30 min after RGD treatment. Live images were taken at 3 min intervals for 1 h. The arrow indicates RGD/RAD application. Data represent the mean protrusion length. Error bars indicate SEM (n = 5 neurons per group). *p < 0.05; **p < 0.01; ***p < 0.001 with one-way ANOVA. I, J, Quantification of dendritic protrusion density in 14 DIV GFP-labeled hippocampal neurons before and after treatment with blank (control), control RAD, or RGD. I, There were more dendritic protrusions in RGD-treated neurons. Data represent the average number of protrusions per 10 μm of dendrite. Error bars indicate SEM (n = 15 neurons per group). J, Time-lapse imaging has revealed a significant increase in the number of dendritic protrusion ∼30 min after RGD application. Live images were taken at 3 min interval for 1 h. The arrow indicates RGD/RAD application. Data represent the average number of protrusions per 10 μm of dendrite. Error bars indicate SEM (n = 5 neurons per group). *p < 0.05; **p < 0.01; ***p < 0.001 with one-way ANOVA.
