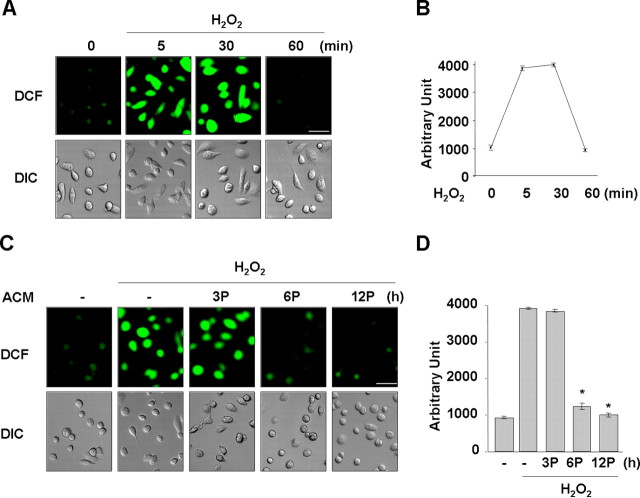
Figure 1.
ACM inhibits H2O2-induced ROS production in microglia. Primary microglia were treated with 100 nm H2O2 for the indicated time periods (A, B) or pretreated (P) with ACM for the indicated times and then treated with 100 nm H2O2 for 5 min (C, D). Intracellular ROS levels were assayed using 10 μm DCF as described in Materials and Methods. A, C, Fluorescence (DCF) images; DIC images were taken using a Zeiss laser confocal microscope. Scale bars, 50 μm. B, D, DCF intensities of cells in A and C were counted using LSM 5 Image Browser (Zeiss). Values are mean ± SEM of 10–15 cells. *p < 0.01 compared with H2O2. The data are representative of at least three independent experiments.

