
Figure 1.
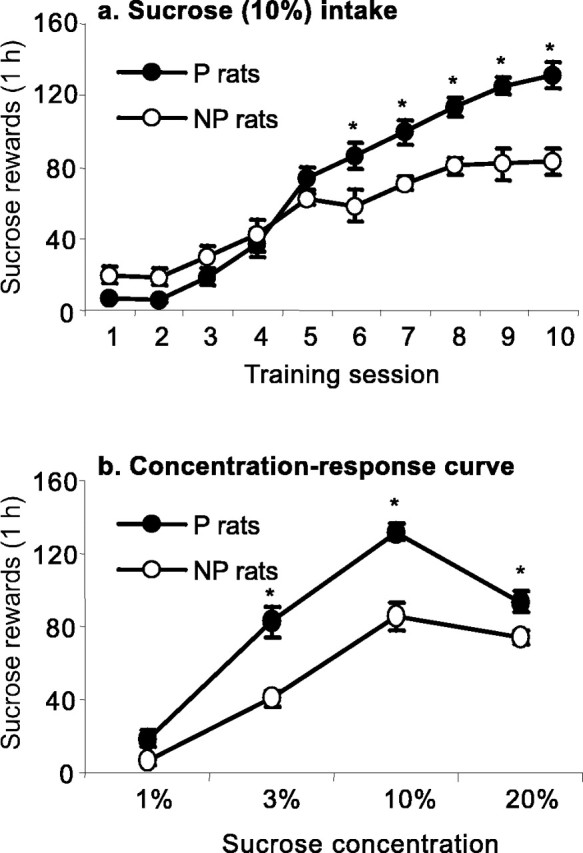
Sucrose self-administration in P and NP rats. a, Mean ± SEM number of sucrose deliveries during the first 10 d of sucrose (10%) self-administration (0.19 ml per reward delivery) under an FR-1 reinforcement schedule (each lever press was reinforced). b, Mean ± SEM number of sucrose deliveries as a function of the sucrose concentration; data are from the concentration–response determination during days 11–22 of sucrose self-administration (3 d per dose). *Different from the NP group; p < 0.05 (Newman–Keuls post hoc test); n = 11 per line.