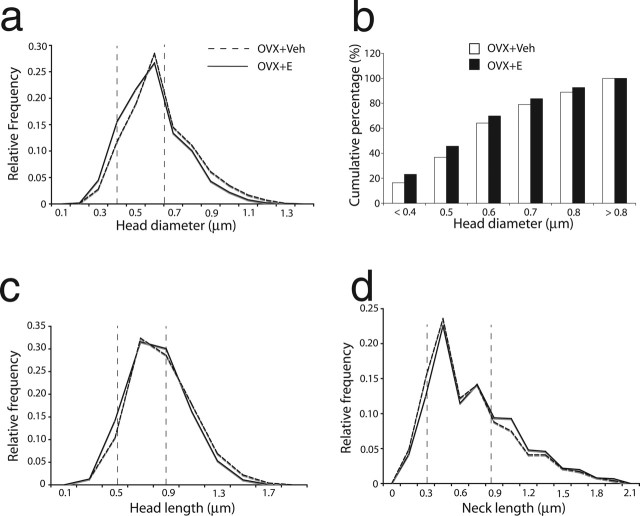
Figure 4.
Frequency distributions of spine head dimensions. The dashed vertical lines show the 25th and the 75th percentiles of the entire spine population. The relative frequency curve (a, Hd; c, Hl; d, Nl) representing the OVX+E group showed a leftward shift for Hd and Hl, which indicated that there were significantly more spines with smaller head dimensions and fewer spines with large head dimensions in the OVX+E group as compared with the OVX+Veh group. The analysis also demonstrated a shift toward longer spine necks in the OVX+E group (d). The analysis of 17β-estradiol effects on cumulative frequency across subgroups was based on Hd measures (b). The Kolmogorov–Smirnov test on Hd cumulative percentages showed an overall trend toward smaller spines with estrogen treatment, but it failed to reach statistical significance. However a nonparametric Wilcoxon rank sums test showed that there are significantly more of the smallest spines (Hd < 0.4 μm) in the OVX + E group than in the OVX + Veh group (p < 0.05).

