
Figure 13.
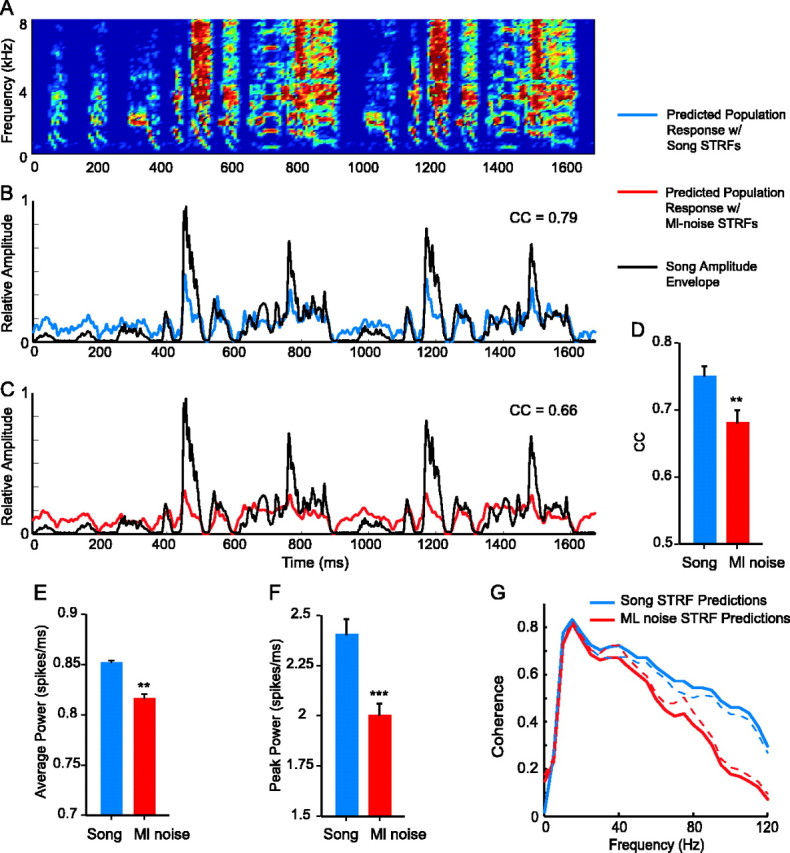
Population synchrony during song processing led to the precise encoding of the temporal patterns in song. A, A spectrogram of song. B, The pPSTH of the predicted response to the sound in A (blue) is plotted with the amplitude envelope of that sound (black). The response follows the temporal pattern; the lines are highly correlated. C, The pPSTH of the response to the sound in A modeled by using ml noise STRFs instead of song STRFs for the same cells (red) is plotted with the amplitude envelope of the sound (black). The lines are less well correlated. D, The mean correlation coefficient (CC) between predicted responses and amplitude envelopes of songs was significantly higher for responses predicted using song STRFs than for those predicted using ml noise STRFs. E, The power of the predicted population response was significantly higher with song STRFs than with ml noise STRFs. F, The mean peak amplitude of responses was also higher for song STRFs. Error bars indicate SE. G, The coherence between predicted population responses and amplitude envelopes was higher for responses predicted by song STRFs than for responses predicted by ml noise STRFs, indicating that song STRF responses encode the temporal patterns of songs with more accuracy than do ml noise STRF responses. The dotted lines show SEs. The two lines differ significantly at 45 Hz (p < 0.05) and above. ***p < 0.001; **p < 0.01.